Shiba Inu prints bullish continuation pattern towards $0.00011
- Shiba Inu price retraced as much as 34% from the most recent new all-time highs.
- Traders have maintained a near-term support level around the $0.000065 value area.
- Bullish continuation pattern shows upside potential remains – but so do risks.

Shiba Inu price was undoubtedly one of the biggest surprises for October. Very few cryptocurrencies in October can claim a monthly close of over 830% from the open. Fewer still can claim to have reached highs as much as 1,138% above the monthly open. So the question many Shiba Inu traders are asking now is this: will Shiba Inu go higher, or is a deeper retracement coming?
Shiba Inu price action prints a bull flag and shows upside continuation, but downside risks are present
Shiba Inu price has a theoretical long trade setup on its $0.0000025/3-box reversal Point and Figure chart. The long idea is a buy stop @ $0.0000775, a stop loss at $0.0000700 and a profit target at $0.0001125. The projected profit target is based on the Vertical Profit Target Method used in Point and Figure analysis. The entry is on the first box above a double-top that would form at $0.0000750. The entry would also break the bear market trend line (red diagonal line), converting Shiba Inu to a bull market.
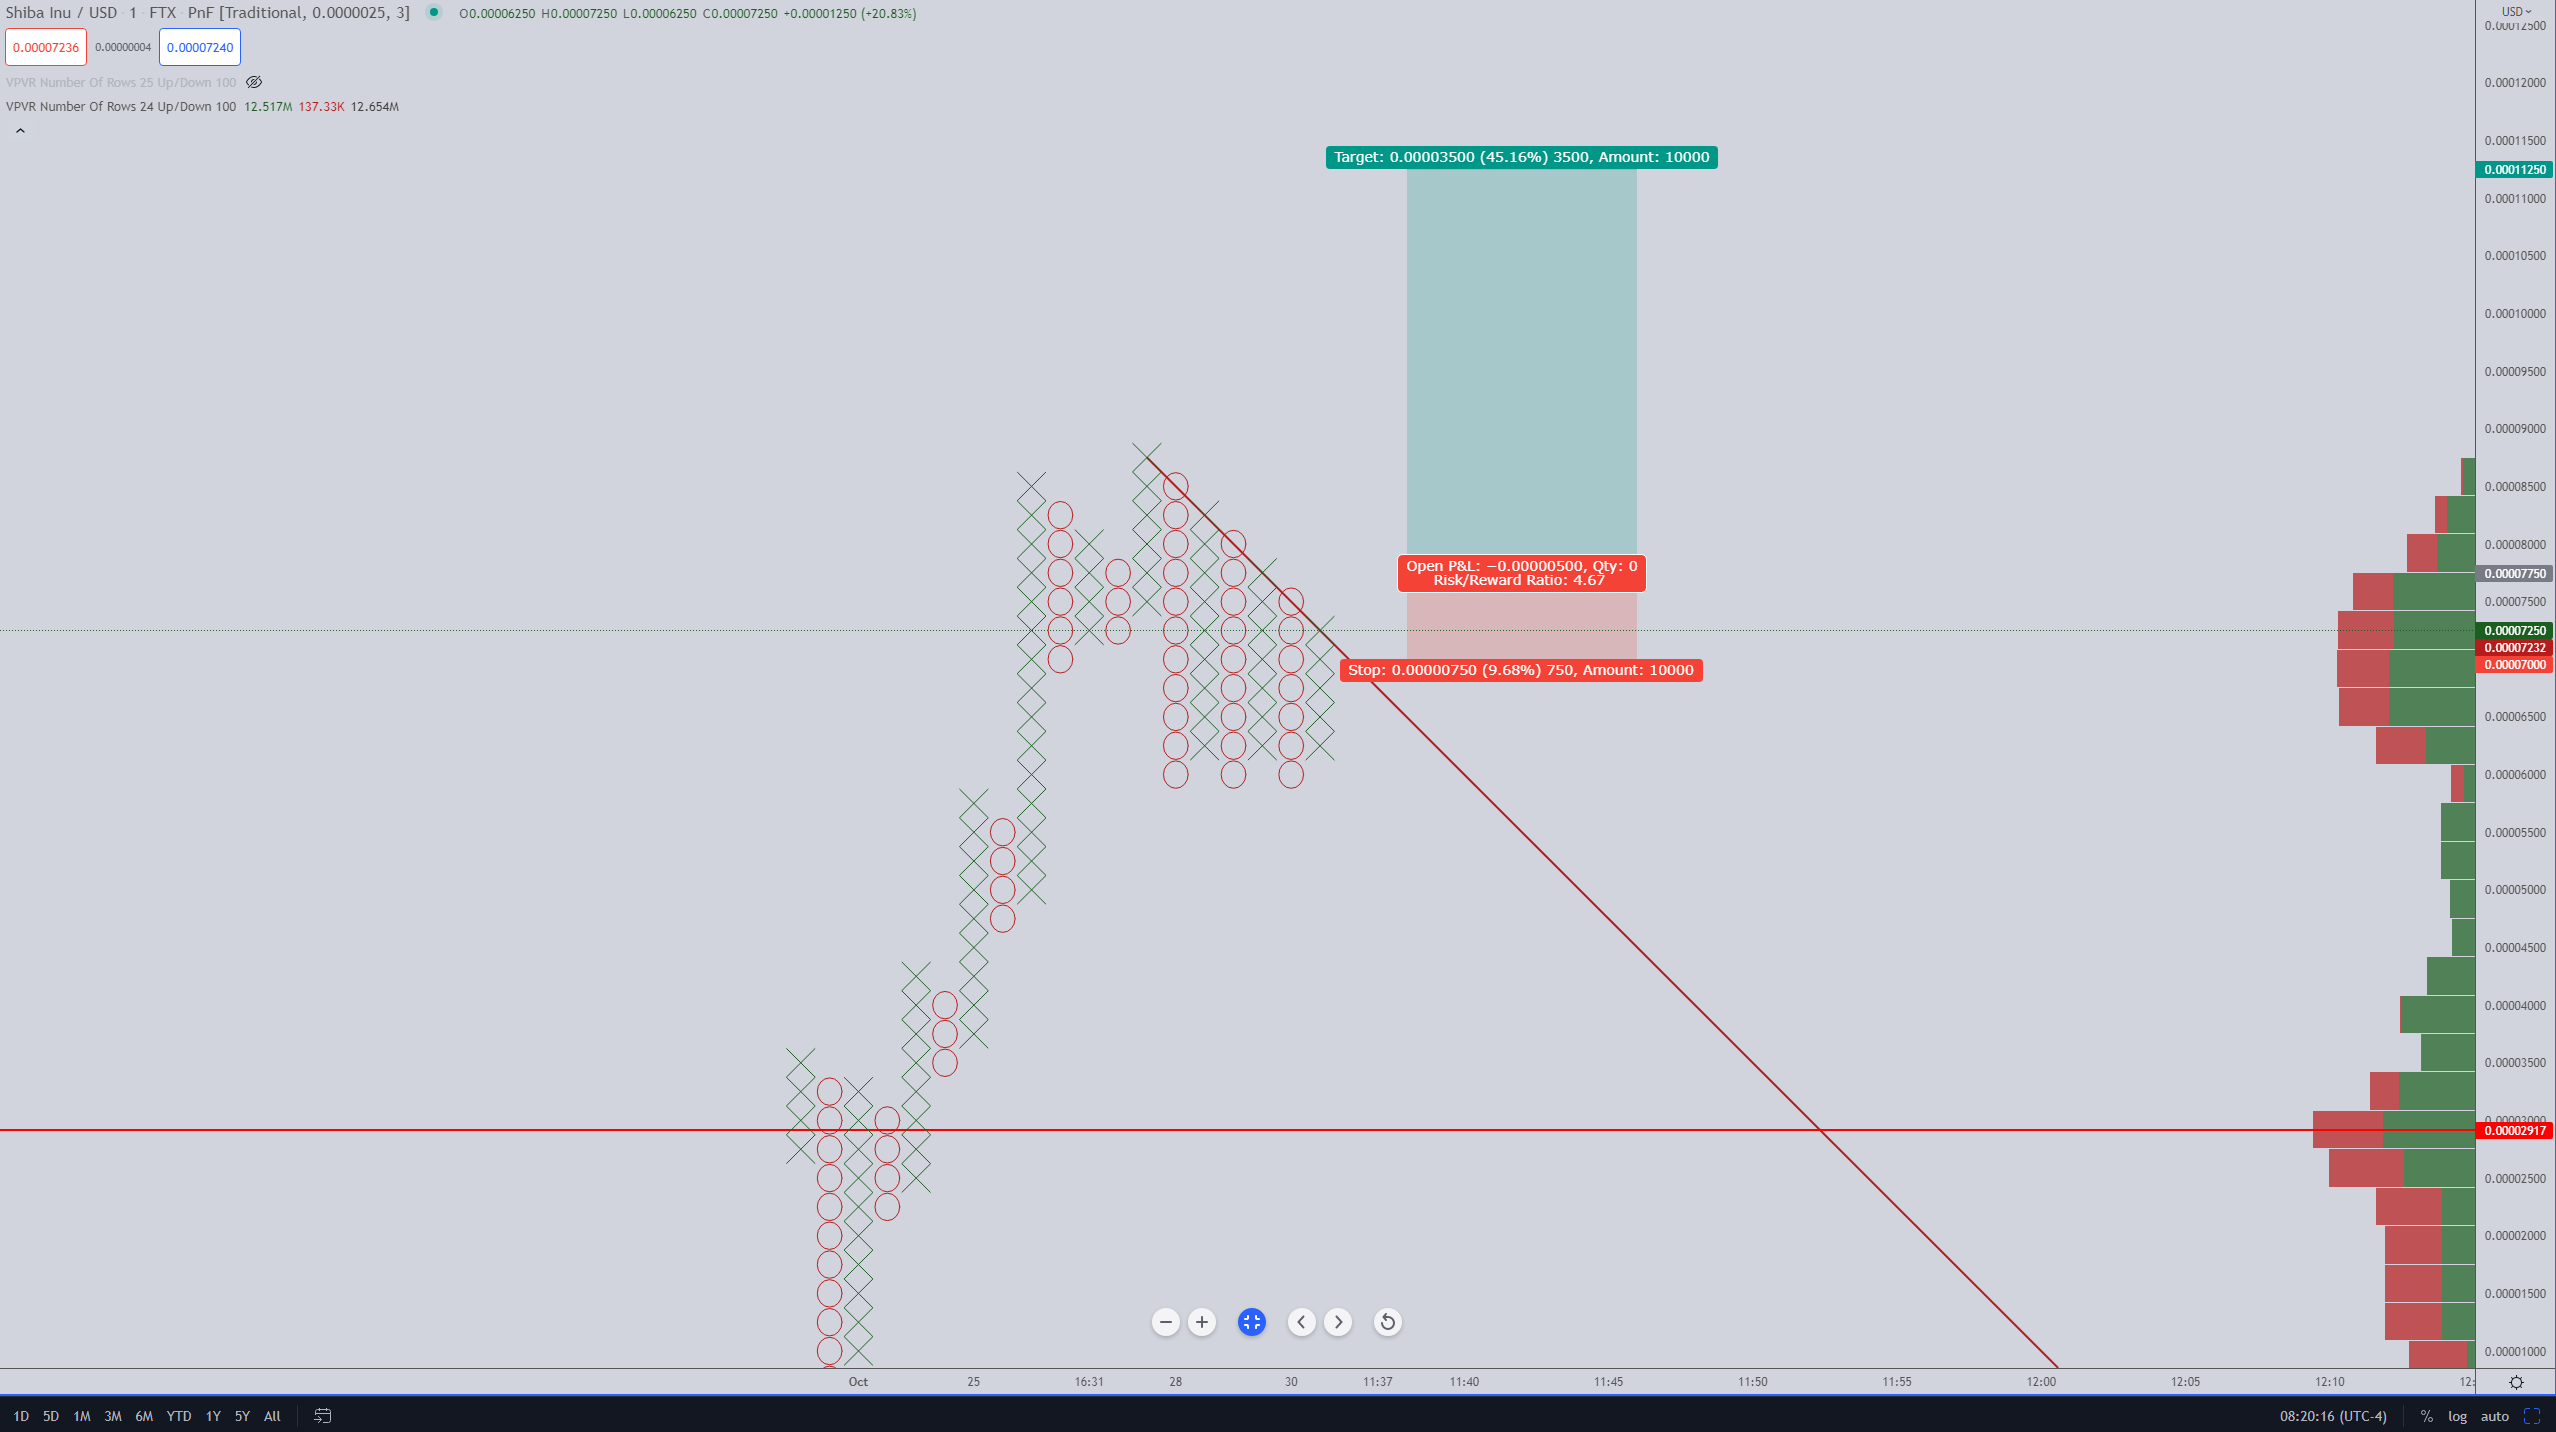
SHIB/USDT $0.0000025/3-box Reversal Point and Figure Chart
The hypothetical long trade will be invalidated if a new column of Os moves lower to $0.0000525.
On the short side of the trade, there is a theoretical short entry with the break of a quadruple bottom. The short idea has a possible entry at $0.0000575, a stop loss at $0.0000675 and a profit target at $0.0000225. While the projected profit target is from the Vertical Profit Target Method, the range may seem a little unrealistic. It is more likely that Shiba Inu price would find support between the Volume Point Of Control at $0.0000300 and the high volume node at $0.0000400.
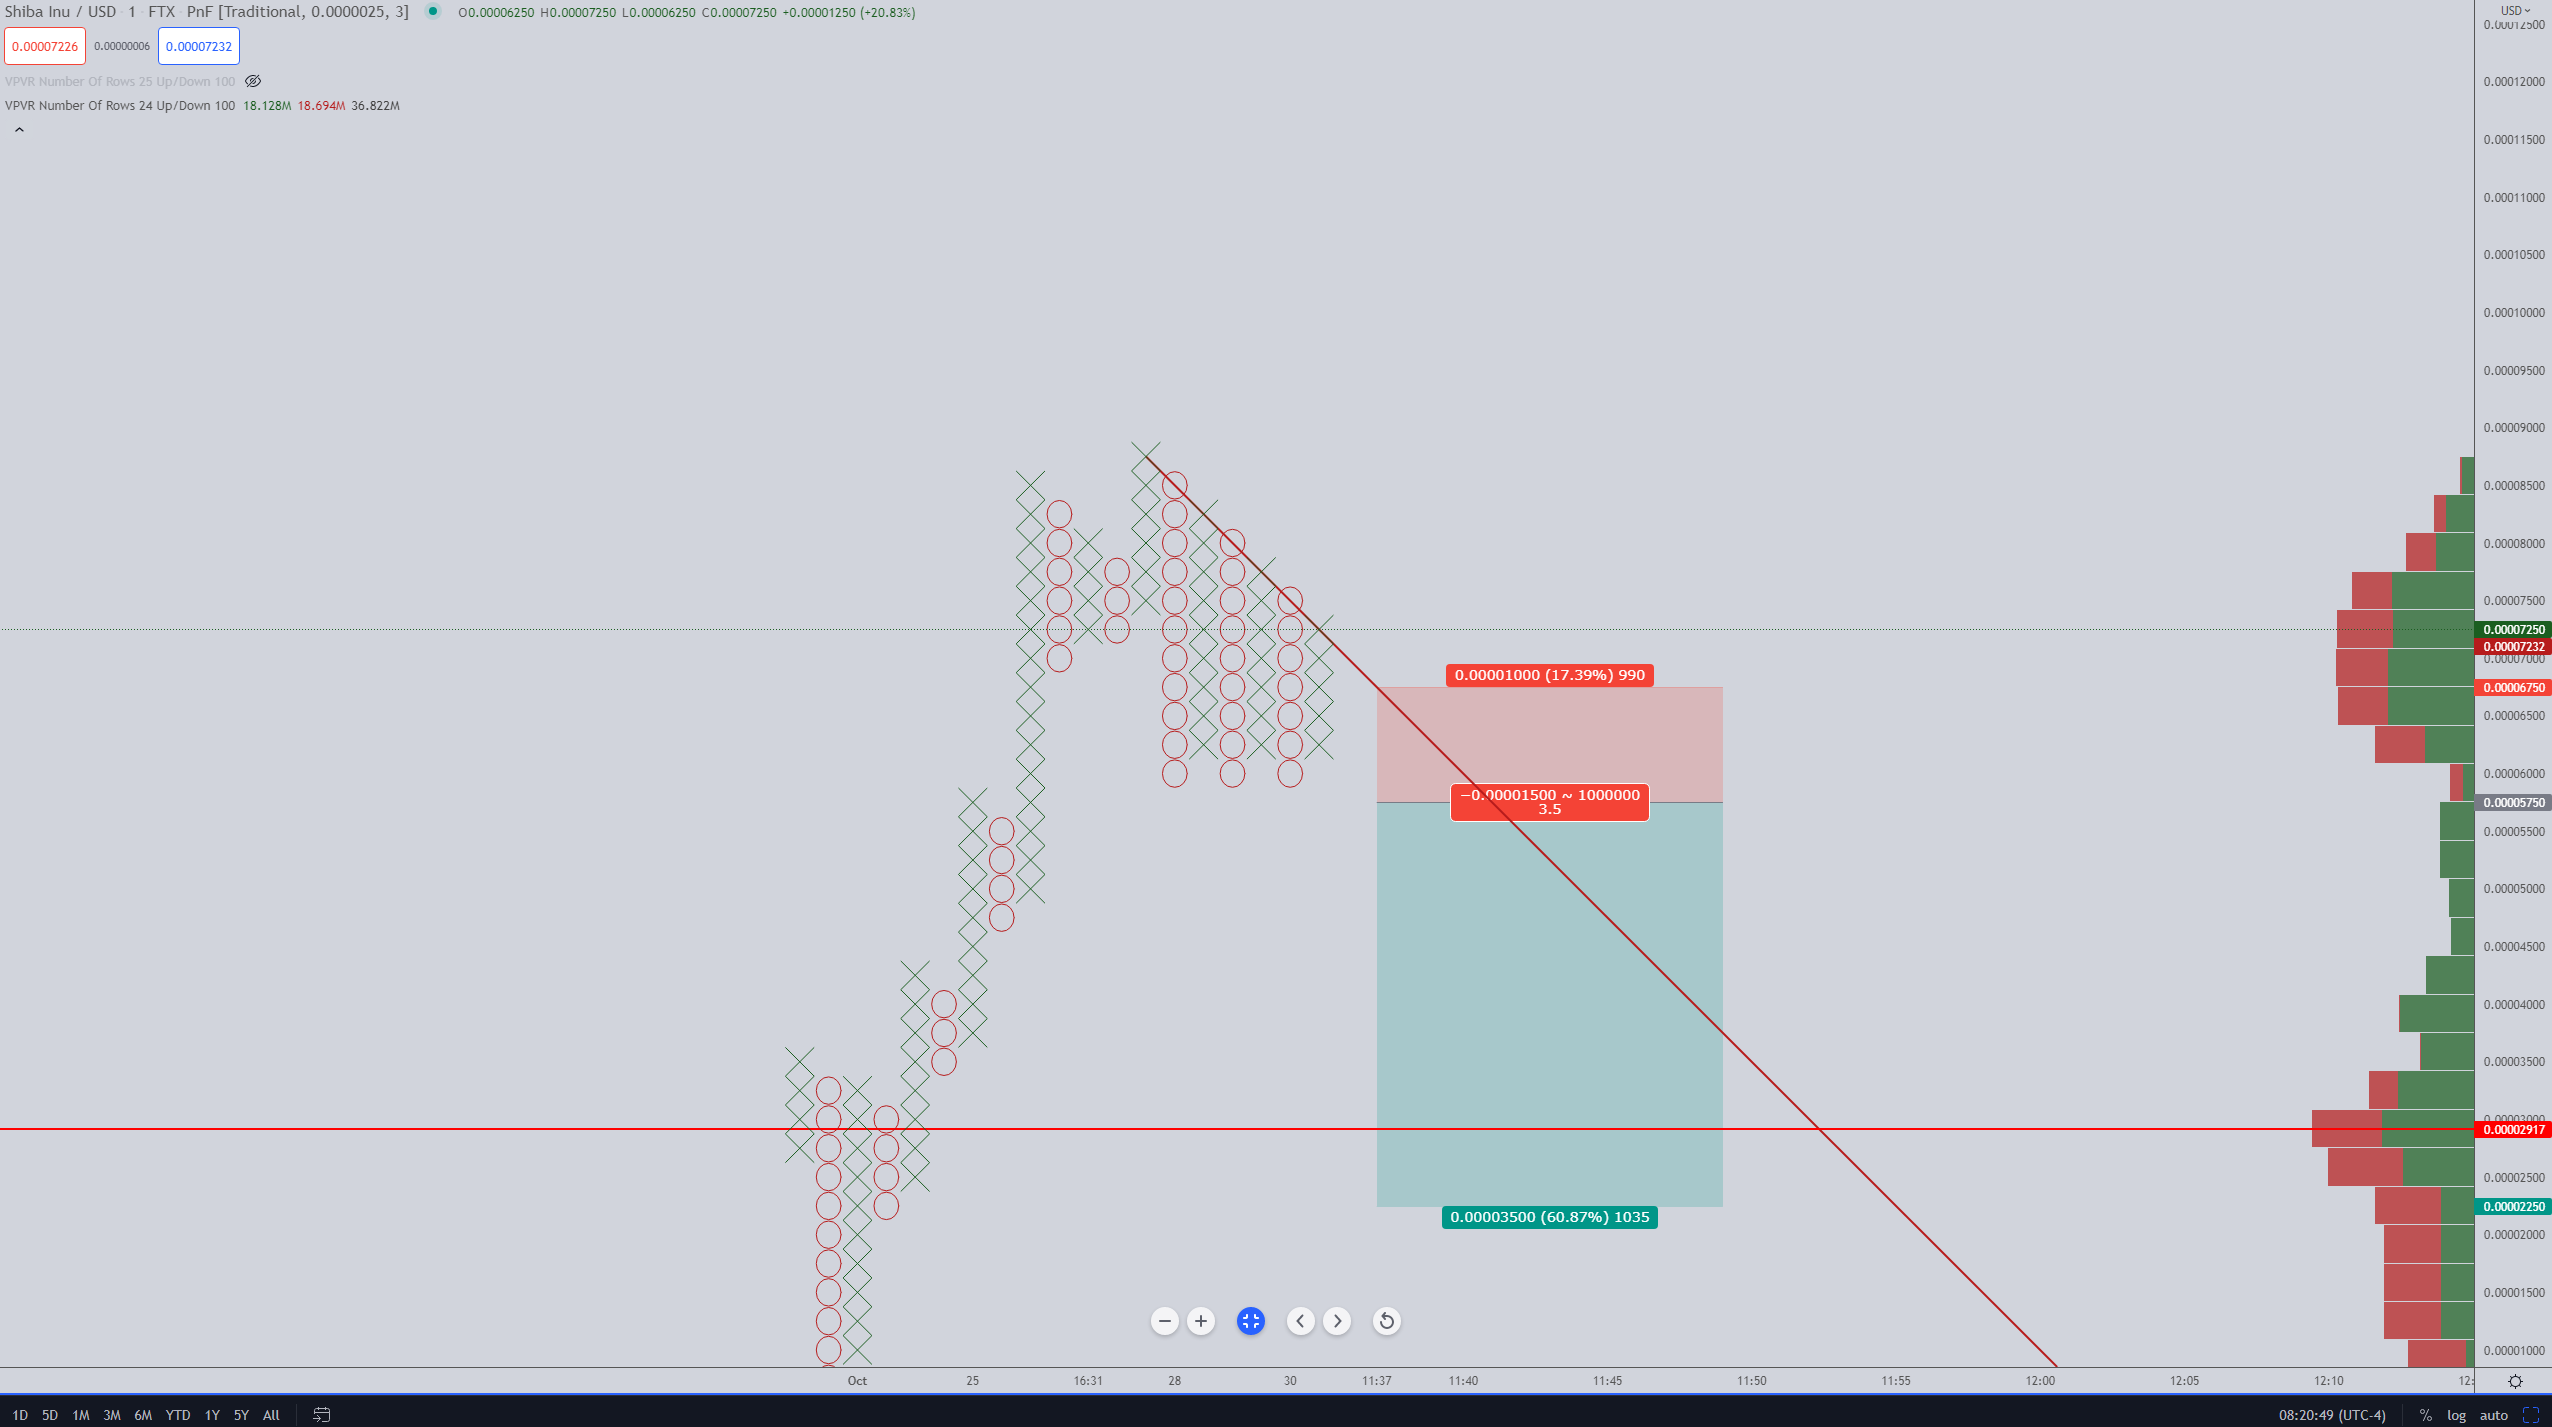
SHIB/USDT $0.0000025/3-box Reversal Point and Figure Chart
The possible short entry idea is invalidated if Shiba Inu price moves above $0.0000850.
Author

Jonathan Morgan
Independent Analyst
Jonathan has been working as an Independent future, forex, and cryptocurrency trader and analyst for 8 years. He also has been writing for the past 5 years.



