Shiba Inu price holds profits as SHIB bulls target $0.0001
- Shiba Inu price faded sharply yesterday in a profit-taking move.
- SHIB price recently made new all-time highs, and traders are looking for the next level going forward.
- A Fibonacci retracement targets $0.00010772 as the next profit level.

Shiba Inu (SHIB) price has been on a tear with an 87% rally on Wednesday. Bulls got greedy and started to take too much profit, however, which led SHIB price to decline 55%, almost 2/3rd of the rally from Wednesday. Going forward, the outlook remains favourable and cryptocurrencies are still in an uptrend, so traders are already pinpointing the next profit level beyond current all-time highs.
Shiba Inu price needs to overcome global market headwinds before making new highs
Shiba Inu price started a bull run on Wednesday with a staggering return. The downside of that quick and big move higher was that many buyers were eager to book profits, which made the rally decelerate and saw a sharp retracement of almost 2/3rd.. In that whipsaw price action, some Fibonacci levels got very well respected, predicting the next profit target.
SHIB price saw its uptrend kicking into gear around the 78.6% Fibonacci level of the cryptocurrencies’ entire ascent at $0.00002782, around October 23. From there, SHIB price first got rejected by the 61.8% Fibonacci level at $0.00004490 before making an apparent breakthrough and going straight for a break above the 23.6% Fibonacci level at $0.00008373. In the correction on Thursday, SHIB price ranged back to the 50% Fibonacci level at $0.00005690.
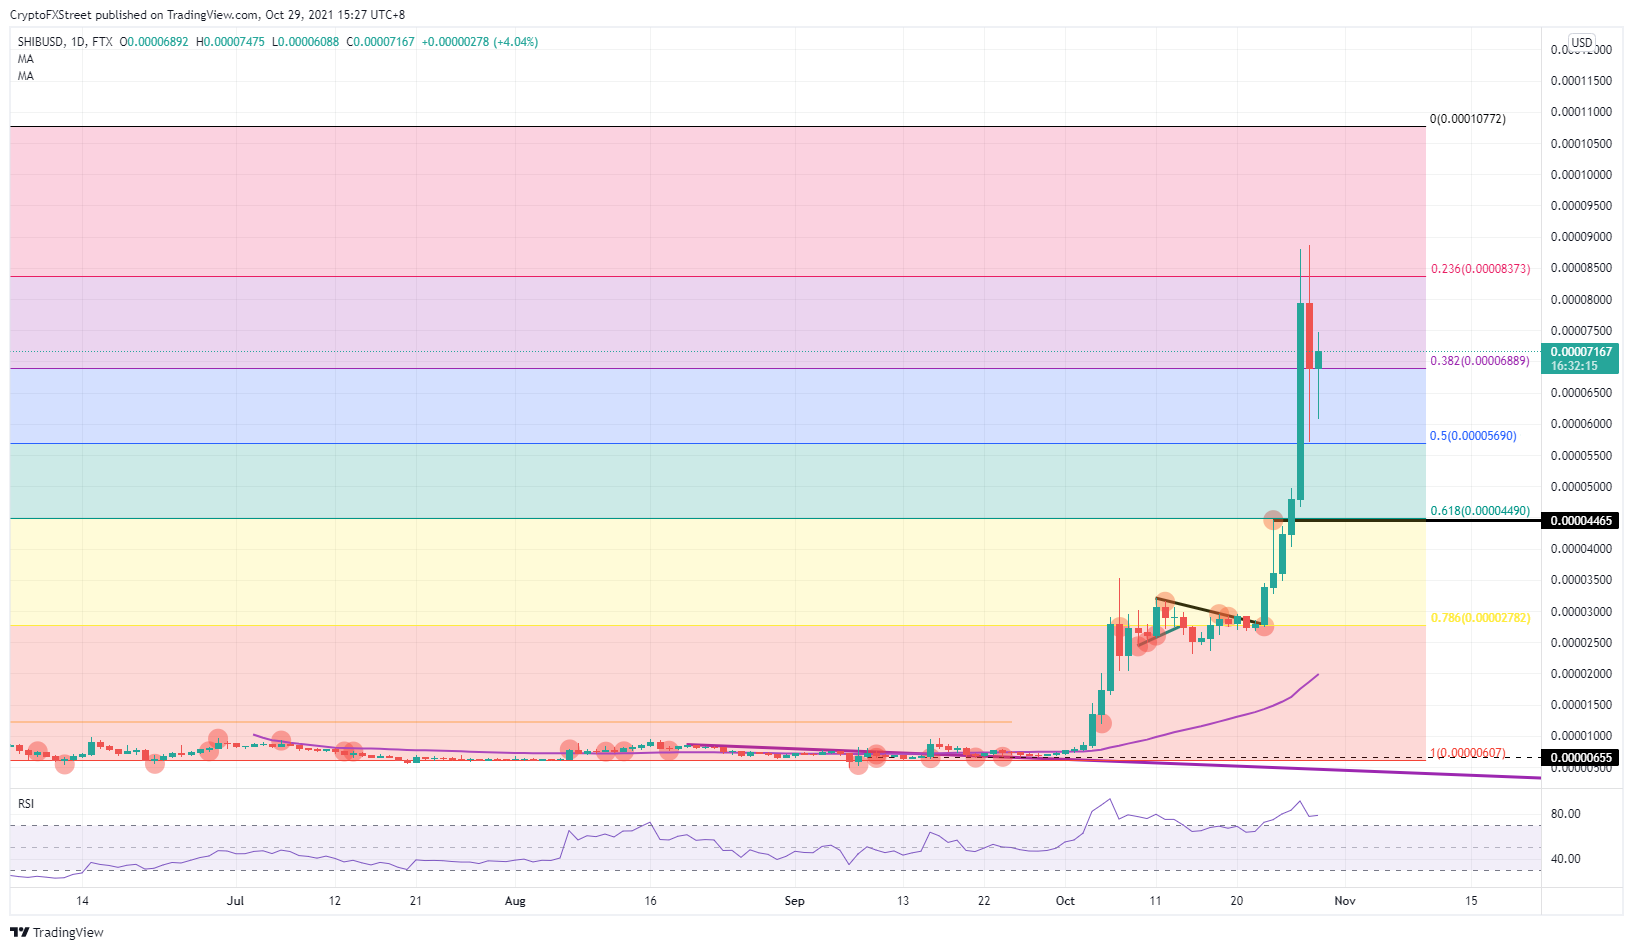
SHIB/USD daily chart
SHIB price, for now, looks to be cooling down a bit with the 38.2% Fibonacci level at $0.00006889 as a pivot point, and with the Relative Strength Index (RSI) firmly in overbought territory, this cool down could be extended into the weekend. A retest of the 50% Fibonacci level would see more buyers come in for support, as they already did on Thursday, and could see another retest of $0.00009000. To fully complete the Fibonacci retracement, the profit target point would be around $0.00010772, which would suggest a break below the $0.00010000 psychological level. .
As global market sentiment is taking a step back today, SHIB price will also be under fire. Shiba Inu price will start to fade below $0.00006889 and might go back to test the 50% Fibonacci level at $0.00005690. In case that level holds, expect support at $0.00004490 to do the trick as this level has not been tested yet and got a firm rejection in the past so that it will hold double importance due to both the Fibonacci retracement and reaction of SHIB price around this area in the past.
Author

Filip Lagaart
FXStreet
Filip Lagaart is a former sales/trader with over 15 years of financial markets expertise under its belt.



