Shiba Inu price targets a return to $0.000025, relief rally for SHIBA is developing
- Shiba Inu price shows significant weakness below the $0.000020 value area.
- New 2022 lows targeted by bears.
- Some key support levels in SHIBA’s oscillators hint at some bullish relief.

Shiba Inu price action continues to fall lower and lower. A push towards new 2022 lows appears likely as buyers have thus far not generated any effective defense for SHIBA.
Shiba Inu price threatens new 2022 lows, but bullish signals may temporarily halt further downside moves
Shiba Inu price action, from an Ichimoku perspective, remains extremely bearish, with no support currently present on the daily chart. The only support zone is the 78.6% Fibonacci retracement at $0.000019 – which is presently holding SHIBA up.
Unfortunately for Shiba Inu price bulls, below $0.000016, there is almost no volume traded within the Volume Profile until the $0.000010 level. This means that any time spent below $0.000016 could generate a flash crash down to $0.000010.
Despite the prolonged drop in Shiba Inu price, the daily Relative Strength Index remains in bull market conditions. SHIBA is currently testing the final oversold level in a bull market at 40. This is the first test of 40 since the prior test from late January to early February 2022.
A theoretical buying opportunity exists for Shiba Inu price on its $0.000002 3/-box reversal Point and Figure chart. The theoretical long setup I a buy stop order at $0.000030, a stop loss @ 0.000024, and a profit target at $0.000048.
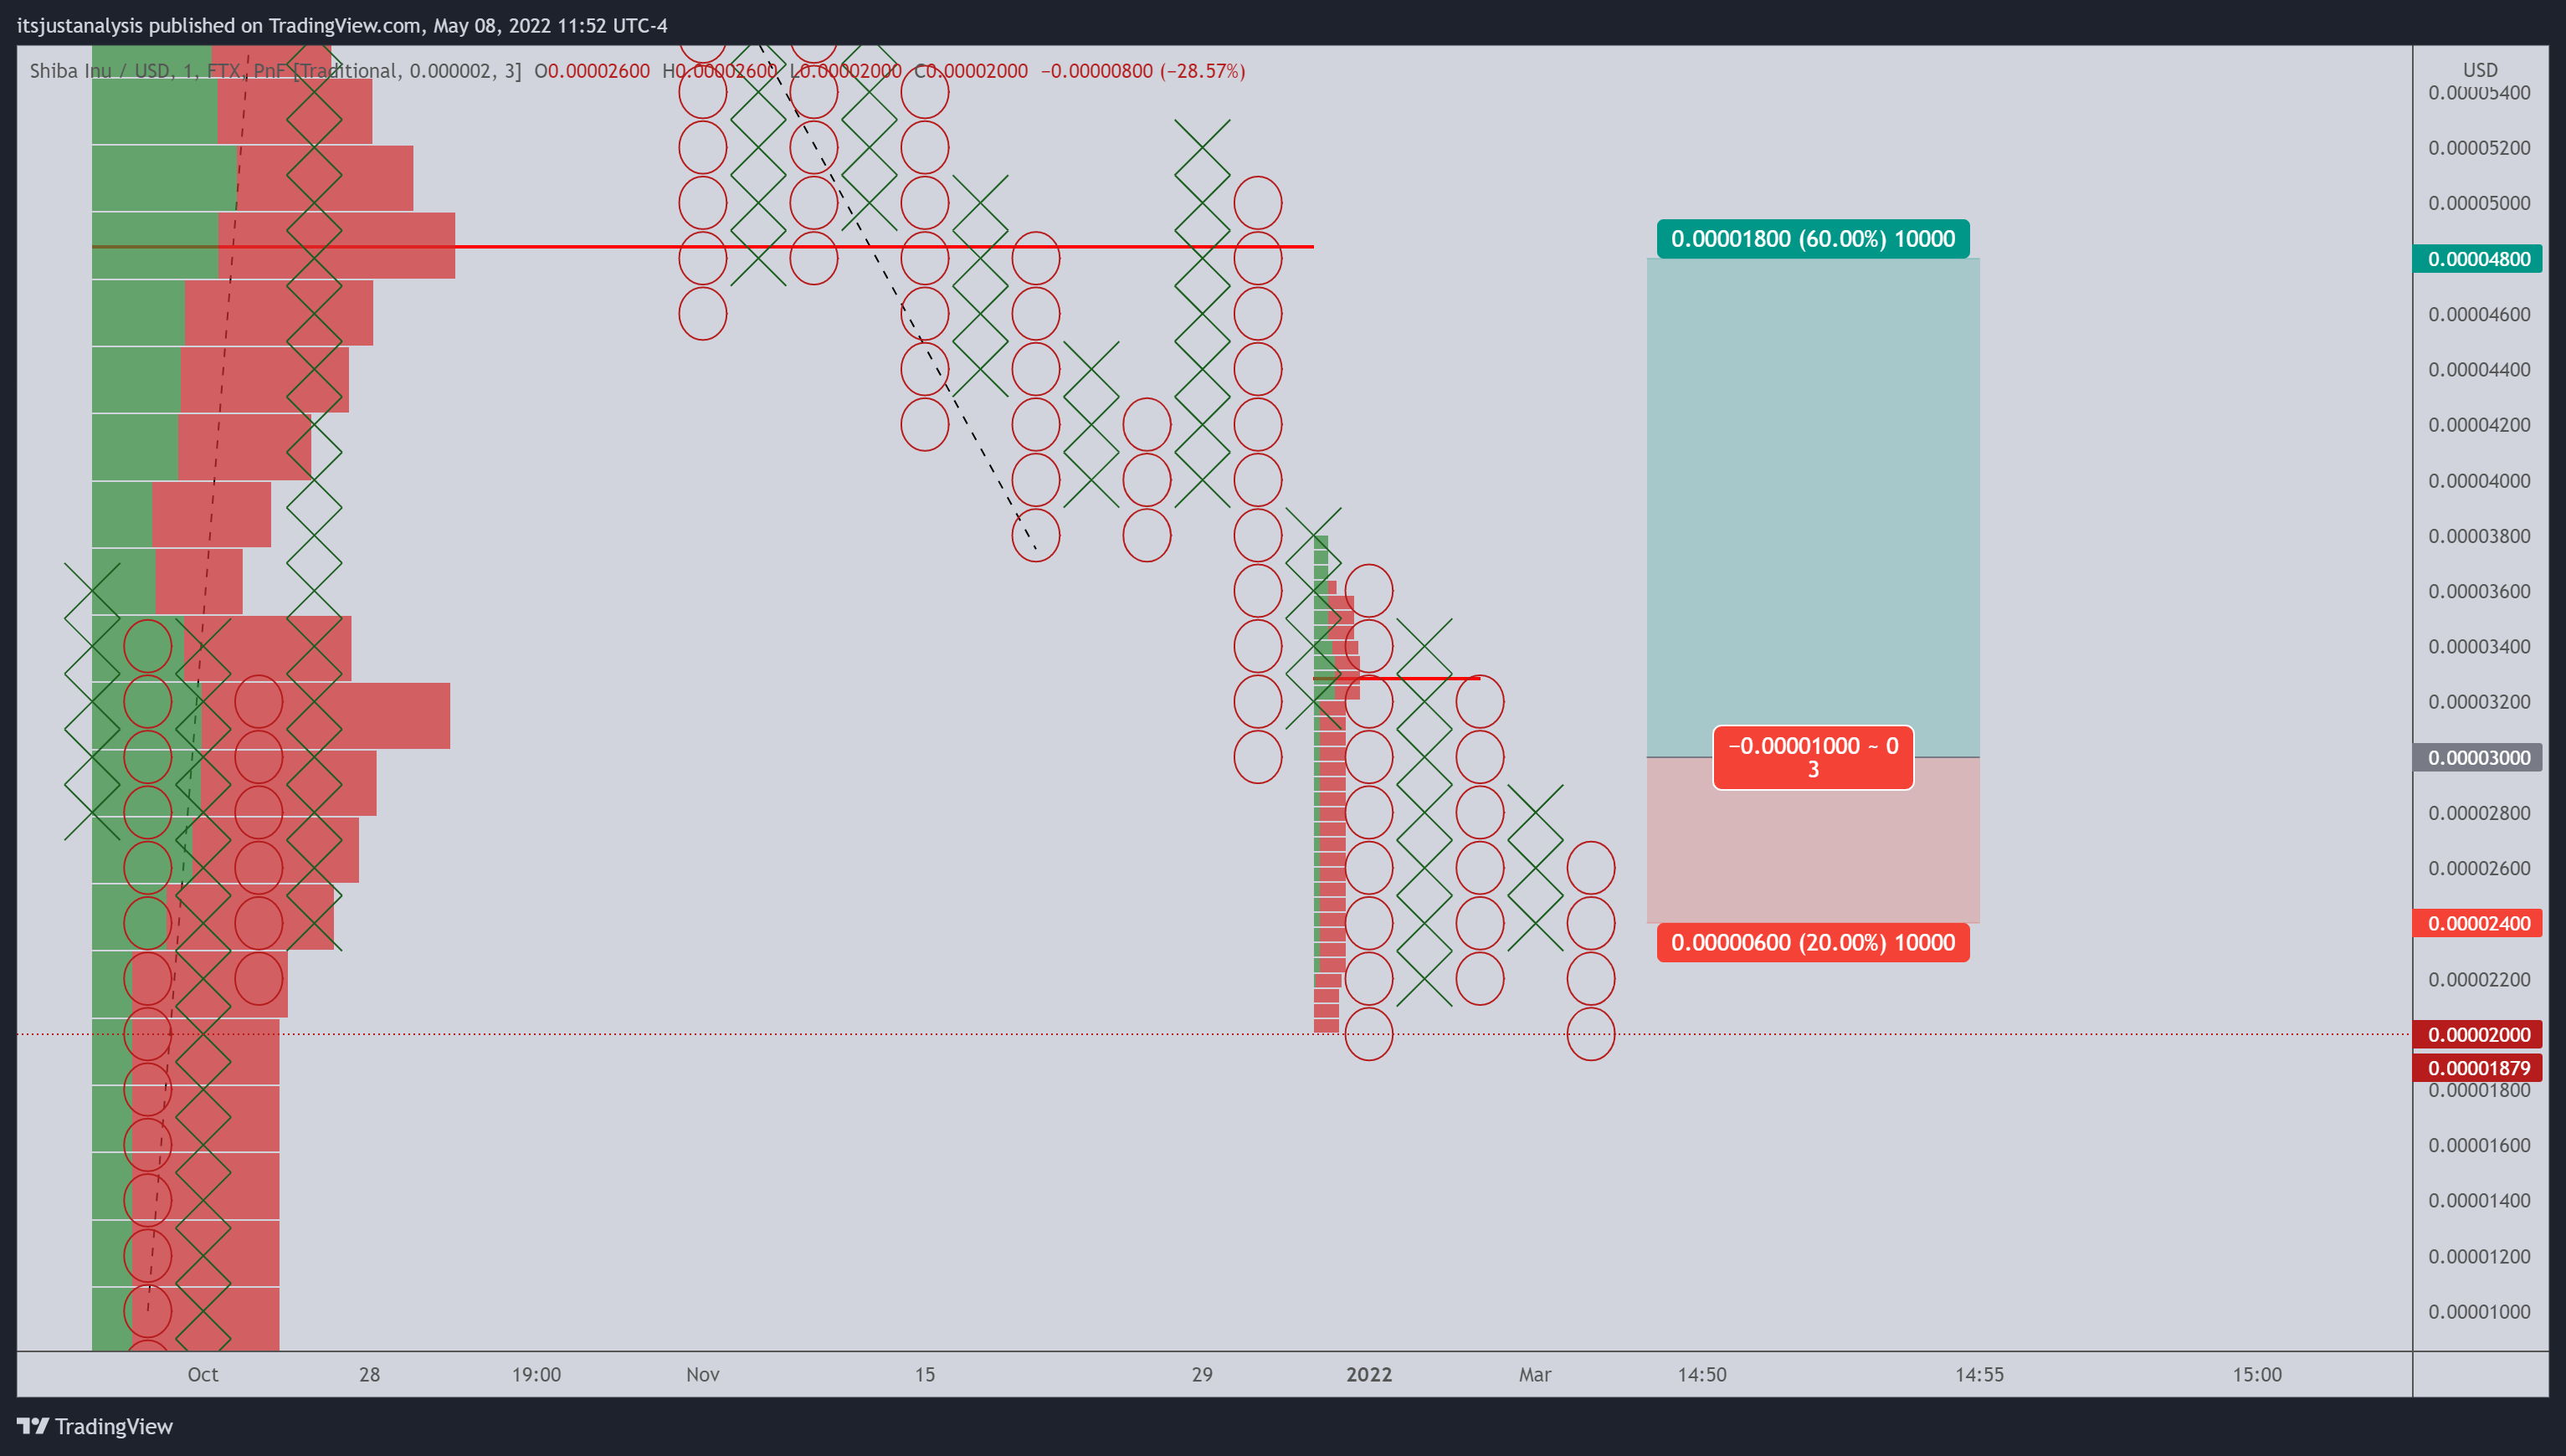
SHIBA/USDT $0.000002/3-box Reversal Point and Figure Chart
The long setup represents a 3 to 1 reward for the risk. A two to three-box trailing stop would help protect any profit made post entry. The trade setup is based on a Point and Figure pattern known as a bear trap. Shiba Inu price could fall as low as $0.000016, and the trade setup would remain valid. However, any drop to $0.000014 would invalidate the theoretical long setup.
Author

Jonathan Morgan
Independent Analyst
Jonathan has been working as an Independent future, forex, and cryptocurrency trader and analyst for 8 years. He also has been writing for the past 5 years.



