Can this bullish setup trigger a 35% breakout for Shiba Inu price
- Shiba Inu price coils up inside a descending triangle, suggesting a bullish breakout possibility
- A decisive close above the upper trend line at $0.0000227 will trigger an explosive move to $0.0000313.
- A daily candlestick close below $0.0000203 will invalidate the bullish thesis for SHIB.
Shiba Inu price shows an interesting setup that could trigger a bullish move. Although optimistic, investors need to be careful considering Bitcoin’s volatility.
Shiba Inu price ready to explode
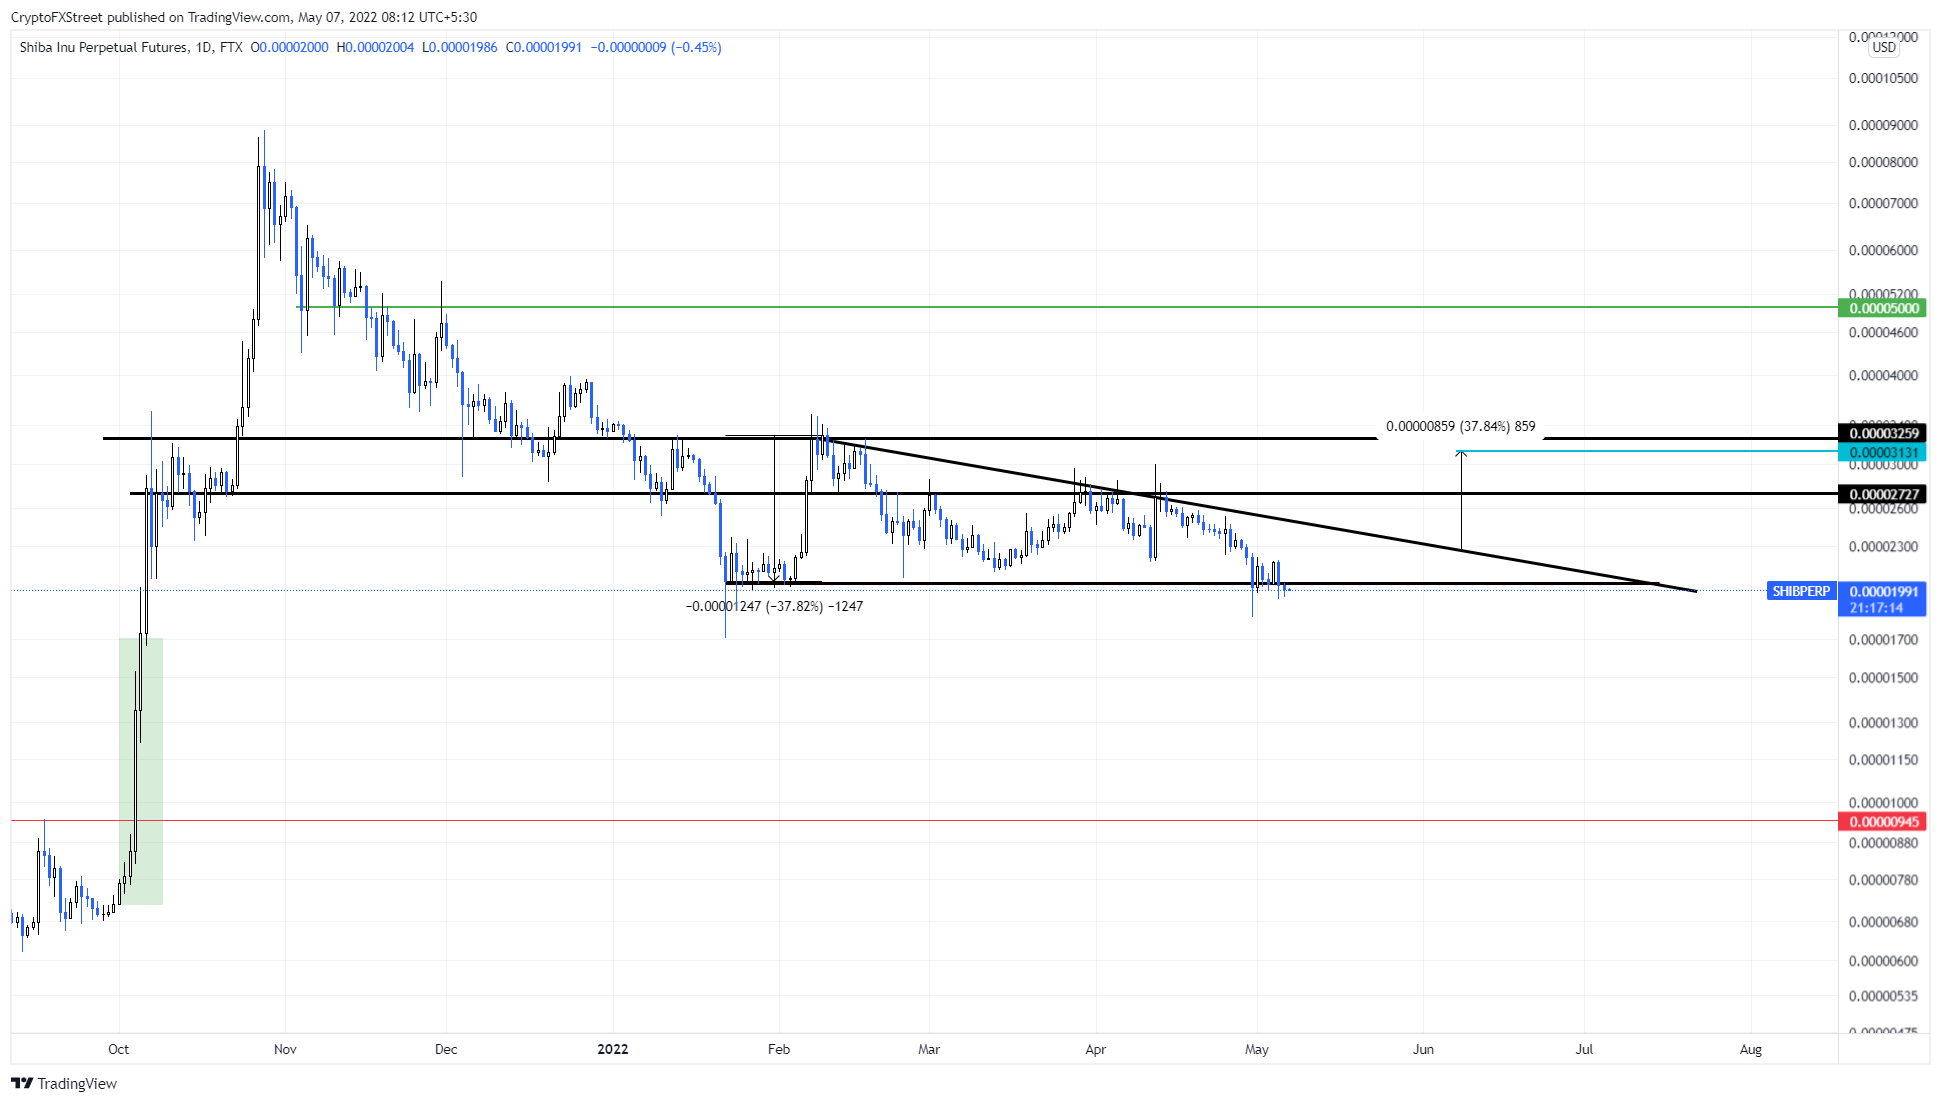
Shiba Inu price action has set up three lower highs and two almost equal lows since January 22, Connecting trend lines to these swing points reveals a descending triangle formation. This technical setup forecasts a 37% upswing, determined by adding the distance between the first swing high and swing low to the breakout point.
Assuming Shiba Inu price breaks through the upper trend line at $0.0000227, the measurement rule forecasts the target at $0.0000313. However, there is a chance this run-up could face temporary hurdles around $0.0000272.
In some situations, an extension of the uptrend to $0.0000325 is also possible, bringing the total gain to 43%.
SHIB/USDT 4-hour chart
On the other hand, a daily candlestick close below the descending triangle’s lower trend line at $0.0000203 will invalidate the setup and also invalidate the bullish thesis for Shiba Inu price. Although there has been an actual breakdown below the triangle, investors need to have a bit of leeway since SHIB is consolidating.
A decisive move below this barrier, however, could trigger a 50% crash to $0.0000094 due to the fair value gap aka the price inefficiency extending from $0.0000170 to $0.0000095.
Author

Akash Girimath
FXStreet
Akash Girimath is a Mechanical Engineer interested in the chaos of the financial markets. Trying to make sense of this convoluted yet fascinating space, he switched his engineering job to become a crypto reporter and analyst.


