Shiba Inu price shows signs of bull trap at $0.0000076
- Sellers got caught in a bear trap with the break to the downside on August 26.
- Price action is back above the 55-day moving average.
- Limited upside could now turn the tables on buyers and put them in a bull trap.
Shiba Inu (SHIB) price is on a choppy road and giving both buyers and sellers headaches. Price action has been descending since August 17, but it was only until August 21 that markets got confirmation of a descending trend line (purple). Sellers eagerly jumped on the signals and succeeded in driving prices below the significant $0.00000760 level. The break of this level resulted in a classic short with a failed test to break above again. The rejection got confirmed three times more before price action dipped further to $0.00000650.
SHIB might be controlled by buyers, but the bull trap looms at $0.00000760
The reason for this possible bull trap unfolding comes from two separate reasons. The first reason is the way buyers gained control. The green ascending trend line from July 20 got so chopped up on August 30 that it did not look proper as an entry point. One good element to remember is that SHIB could push above the 55-day Simple Moving Average (SMA). The risk to the upside, however, is the triple belt of resistance hanging over the current price action.
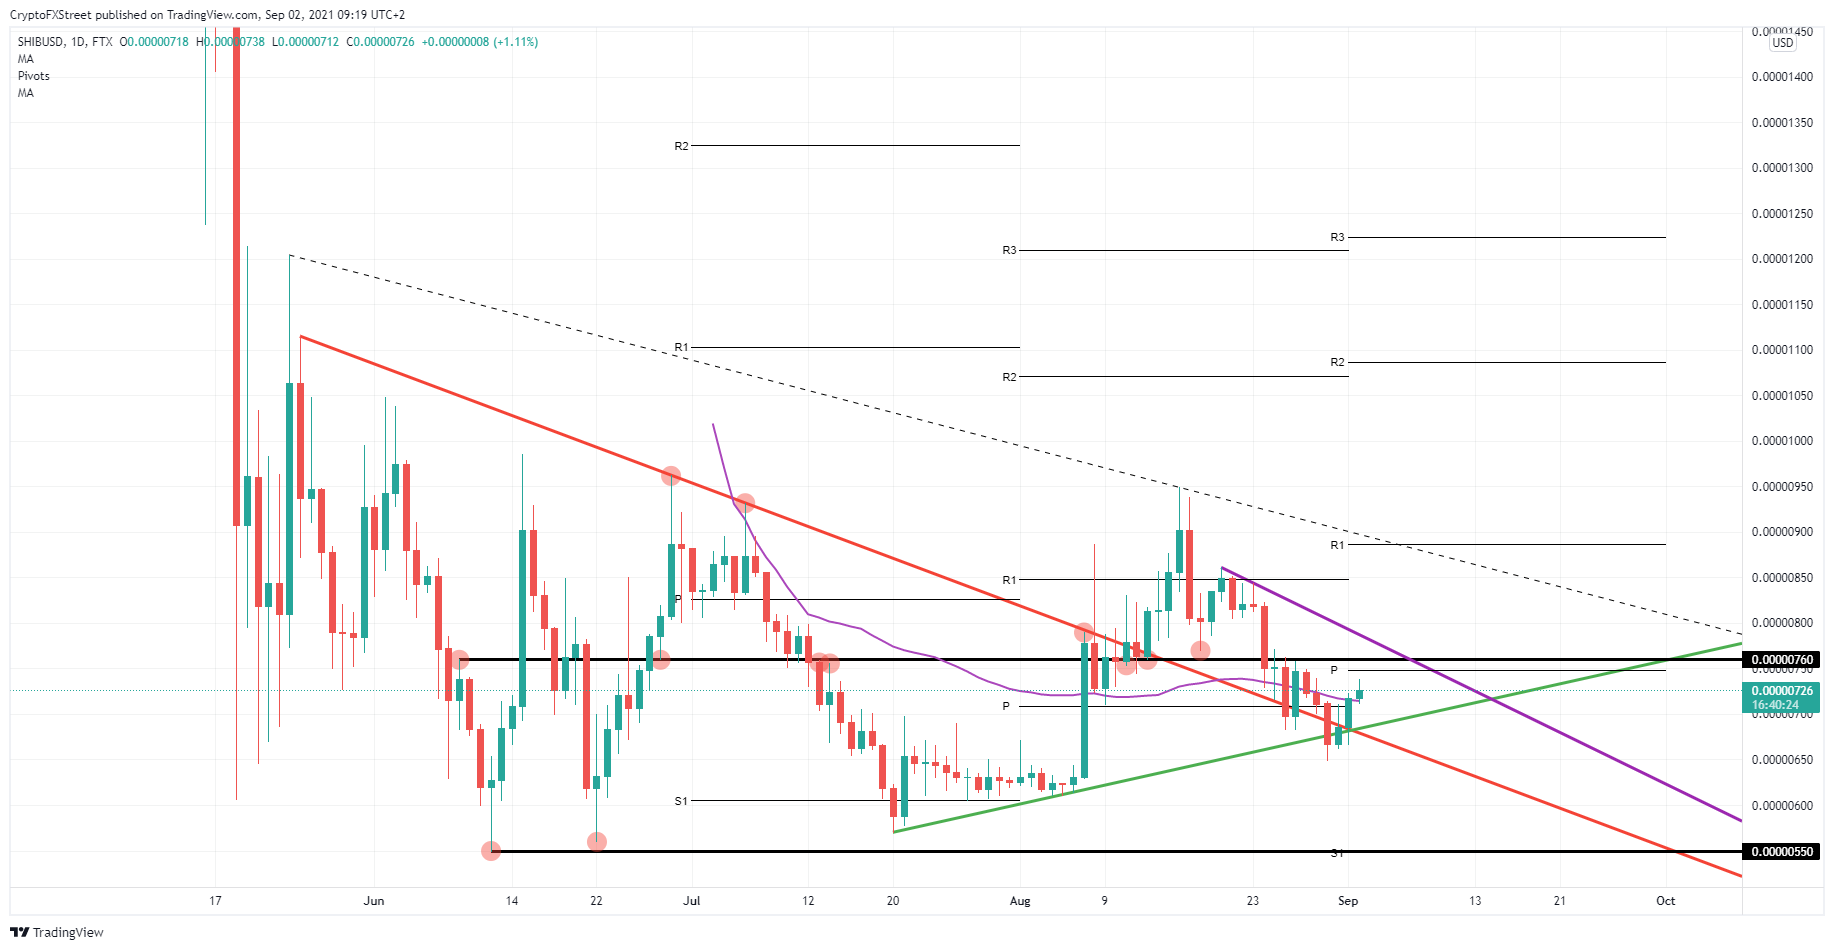
SHB/USD daily chart
The first resistance is the monthly pivot for September at $0.00000748. It is always necessary to have support and resistance levels lined up. The second reason is $0.00000760, which has proven its importance already and originates from June 9. The third and last factor for muted upside is the purple descending trend line forming from August 20. This makes it very limited to get much upside for buyers in the short term. Sellers have these three levels as good entry points for a fade-in to build a short.
However, in the case of buyers who can push on, expect a test of the R1 resistance level at $0.00000870. That would fall in line as well with the dotted descending trend line from May 24.
On the downside, sellers will still have $0.00000550 lined up as the ultimate profit-taking level.
Author

Filip Lagaart
FXStreet
Filip Lagaart is a former sales/trader with over 15 years of financial markets expertise under its belt.


