Shiba Inu Price Prediction: SHIB to run another 76% after making new all-time high
- Shiba Inu price has witnessed an astronomical rally, as it surged over 200% since October 23, recording a new all-time high.
- The buyers are not done with aiming for higher targets, as SHIB projects a 76% rally.
- The prevailing chart pattern suggests a bullish projection of a 400% bull run after Shiba Inu price sliced above its upside trend line.

Shiba Inu price has had a spectacular rally of over 200% since slicing above the governing bullish technical pattern on October 23, reaching a new all-time high at $0.00008825. SHIB continues to target bigger aspirations, as the prevailing chart pattern suggests that the token’s bull run is not over yet.
Shiba Inu price sets higher targets
Shiba Inu price reached a new record high following a break above the resistance trend line given by the bull pennant on the daily chart. The conservative target given by the prevailing chart pattern suggested an 80% climb from its topside trend line, projecting a rally toward $0.00005085.
However, SHIB bulls managed to exceed buyers’ expectations, which means that the optimistic target given by the governing technical pattern is on the radar, with a 400% rally from the breakout line toward $0.00014369.
Shiba Inu price is halfway on the road toward the bullish target, as SHIB already surged 200% from the upper boundary of the bull pennant.
If SHIB bulls continue to incentivize Shiba Inu price to move higher, the next target for the token is at the 127.2% Fibonacci extension level at $0.00010617, then at the 161.8% Fibonacci extension level at $0.00012873 before the token reaches its bullish target at $0.00014369.
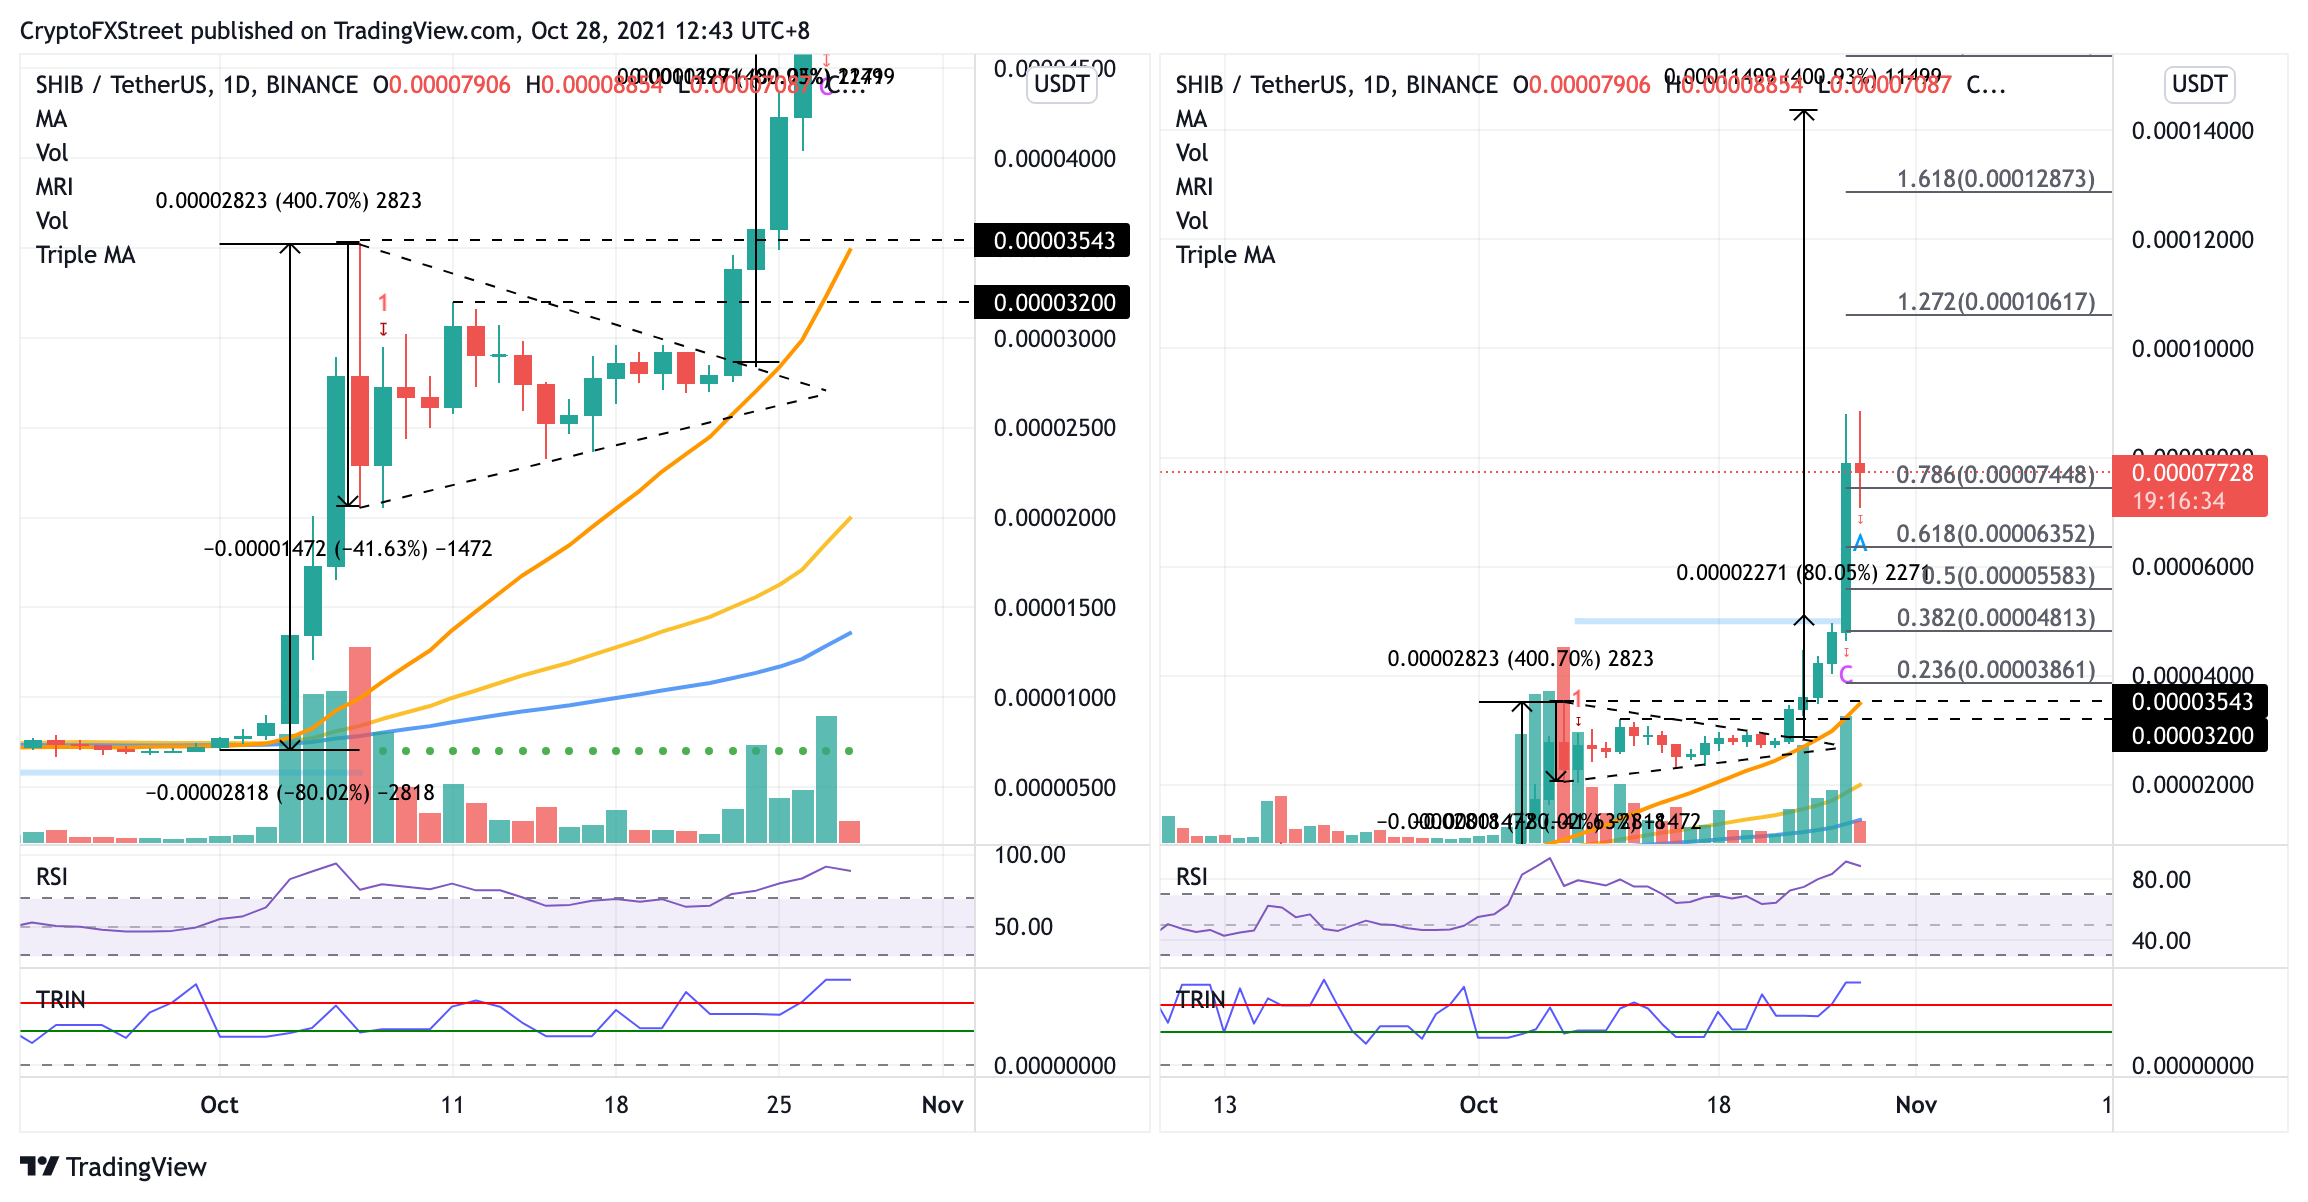
SHIB/USDT daily chart
Investors should note that the Relative Strength Index (RSI) is indicating that Shiba Inu price is overbought, which could prompt a correction for the token. The Arms Index (TRIN), which gauges overall market sentiment, also suggests that traders are engaging in more selling activity as they continue to lock in gains following the token’s tremendous run.
As a result, SHIB could retrace and consolidate until a massive surge in buying pressure occurs. Shiba Inu price would discover immediate support at the 78.6% Fibonacci retracement level at $0.00007448, then at the 61.8% Fibonacci retracement level at $0.00006352. Further selling pressure could see the canine-themed token drop toward the 38.2% and 23.6% Fibonacci retracement levels, at $0.00004813 and $0.00003861, respectively.
An additional reliable foothold will emerge at the October 7 high at $0.00003543, coinciding with the 21-day Simple Moving Average (SMA).
Author

Sarah Tran
Independent Analyst
Sarah has closely followed the growth of blockchain technology and its adoption since 2016.



