Shiba Inu price may provide a once-in-a-bear-market opportunity
- Shiba Inu price shows a bounce off the point of control (POC) at $0.0000118.
- A daily candlestick close below this level could trigger a 13% to 28% downswing.
- A bounce off $0.0000087 or $0.0000083 could trigger a 105% upswing in SHIB.

Shiba Inu price hovers around a stable support level formed over the last three months. A breakdown of this barrier could trigger a steep correction that could provide one of the best trading opportunities in this bear market.
Shiba Inu price at inflection point again
Shiba Inu price is currently grappling with a key support level provided by the POC at $0.0000118, which is the highest traded volume level since April 11. This level has been helpful in triggering run-ups for SHIB since July 29.
The most recent bounce led to a 53% ascent, creating a double top at $0.0000180. Since then, Shiba Inu price has undone the gains and is back at the POC, looking for a refill.
While this resurgence of buyers might arrive and trigger a quick run-up, investors need to think about the long game and big gains. For this outlook, market participants should be comfortable in tolerating a breakdown of the POC at $0.0000118 and a decline of 9% to retest the immediate support level at $0.0000106.
In some cases, SHIB could stoop as low as $0.0000083 to fill the imbalance at these levels. Assuming Shiba Inu price does this and then recovers above the weekly support level at $0.0000087, investors can expect this development to trigger a massive run-up.
A 104% rally is potentially predicted that will allow SHIB price to sweep the equal lows formed at $0.0000180. Therefore, only patient buyers will have the chance to get on this train and ride it to the destination.
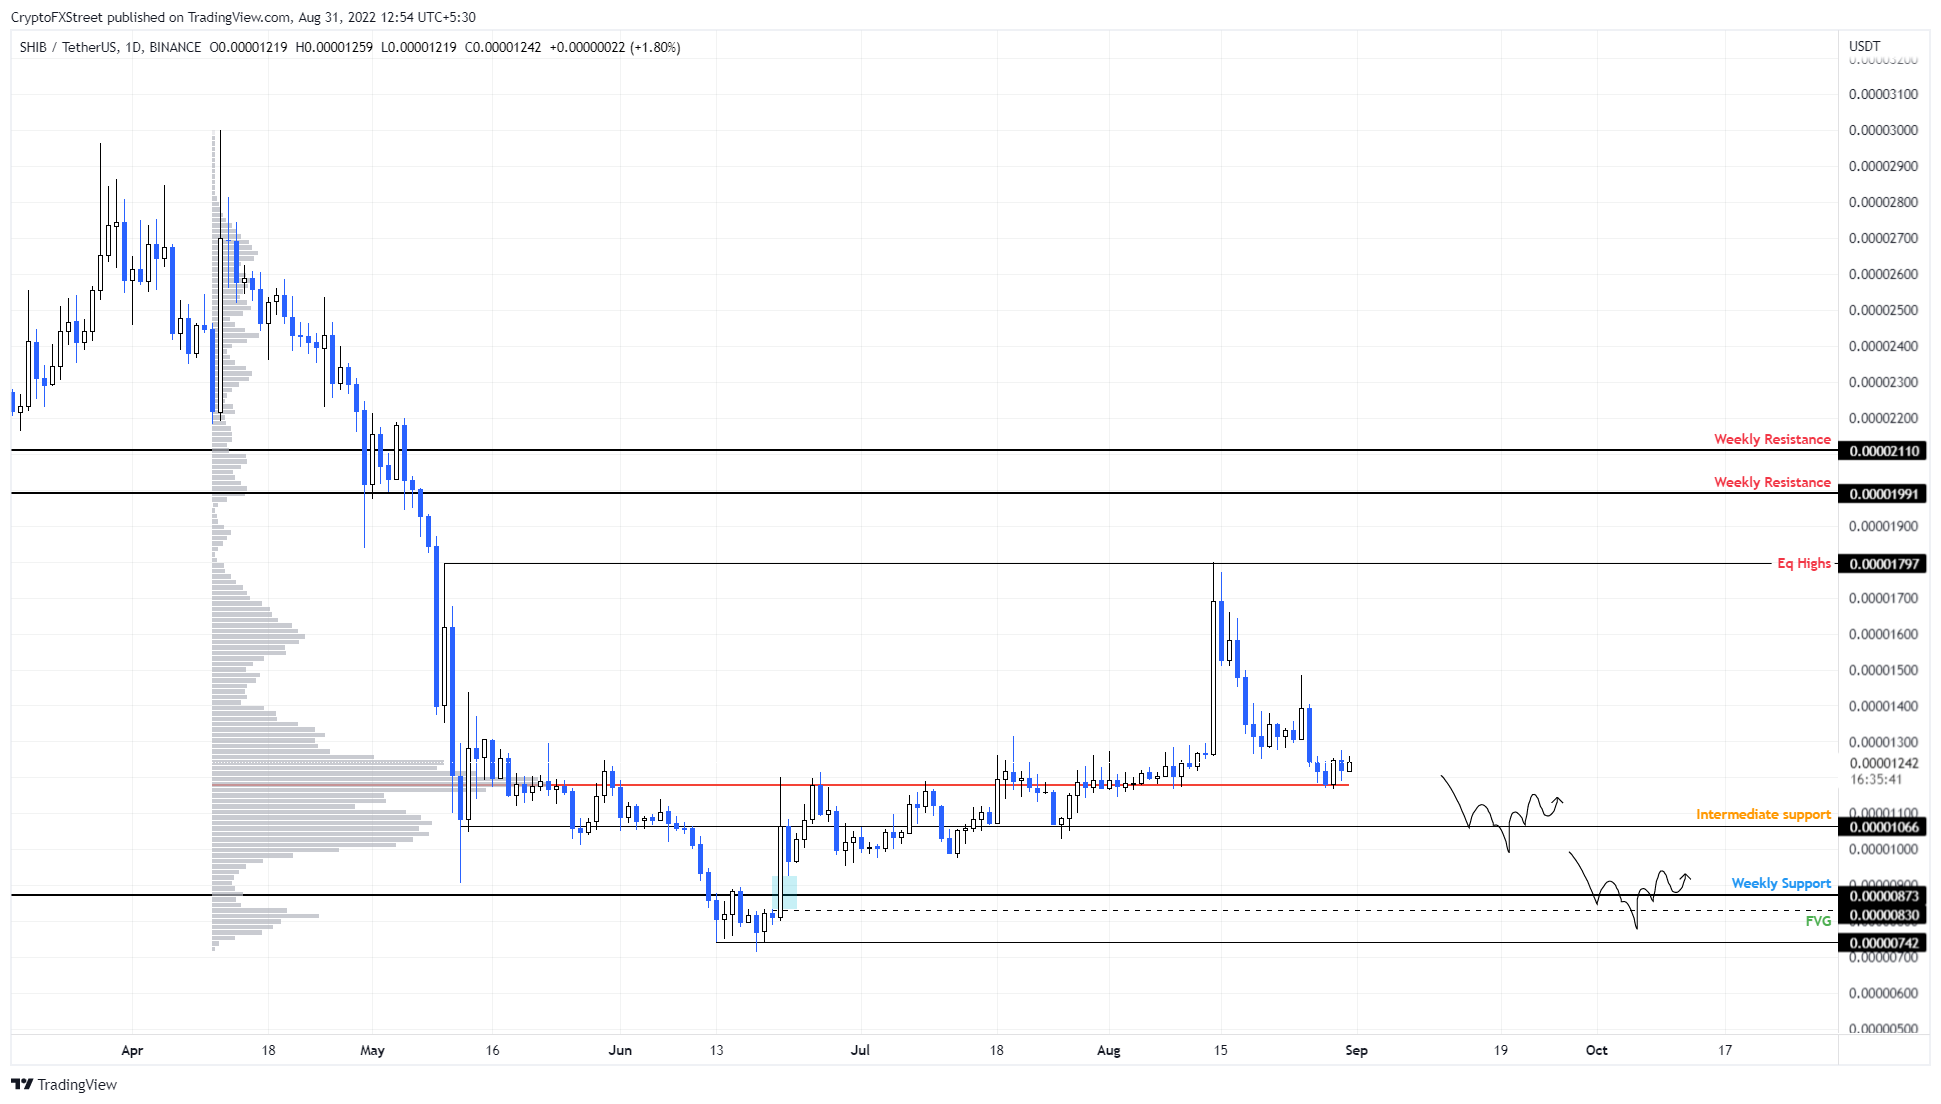
SHIB/USDT 4-hour chart
While the bullish outlook does look promising, the correction to $0.0000087 might be cut short at the $0.0000106 support level. In this case, Shiba Inu price may rally only 68%.
However, if SHIB produces a daily candlestick close below $0.0000074 without a quick recovery, it will create a lower low and invalidate the bullish thesis for Shiba Inu price.
Note:
The video attached below provides a short-term outlook of Shiba Inu price instead of the mid-term outlook described above.
Author

Akash Girimath
FXStreet
Akash Girimath is a Mechanical Engineer interested in the chaos of the financial markets. Trying to make sense of this convoluted yet fascinating space, he switched his engineering job to become a crypto reporter and analyst.



