Shiba Inu Price Forecast: SHIB rallies as trading volume rises 228% amid increase in bullish bets
- Shiba Inu extends its gains by 8% on Wednesday, rallying over 15% so far this week.
- Data shows that SHIB’s trading volume rose 228% in the last 30 days, bolstering the platform’s bullish outlook.
- The technical outlook suggests a rally continuation as bullish bets increase among traders.

Shiba Inu (SHIB) price extends its gains by 8% and trades at $0.000015 at the time of writing on Wednesday, rallying over 15% so far this week. On-chain data shows that SHIB’s trading volume rose 228% in the last 30 days, bolstering the platform’s bullish outlook. Additionally, the technical outlook suggests a rally continuation as bullish bets increase among traders.
Shiba Inu trading volume surges while traders bet for price rise
Shiba Inu’s official social media platform reposted on Tuesday that its ShibaSwap decentralized exchange (DEX) trading volume is “UP 228% in the last 30 days”. This rise in trading volume indicates a surge in traders’ interest and liquidity in the SHIB chain, bolstering the platform’s bullish outlook.
HUGE growth for ShibaSwap!
— The Shib (@TheShibmagazine) March 25, 2025
Trading volume is UP 228% in the last 30 days, making it one of the fastest-growing DEXs!
Is this the start of a new era for $SHIB?
Read morehttps://t.co/8yskrsSfrX
Another bullish sign is Coinglass’s SHIB long-to-short ratio, which reads 1.08 and has been constantly rising, nearing its monthly high. This ratio above one reflects bullish sentiment in the markets as more traders are betting for the asset price to rise.
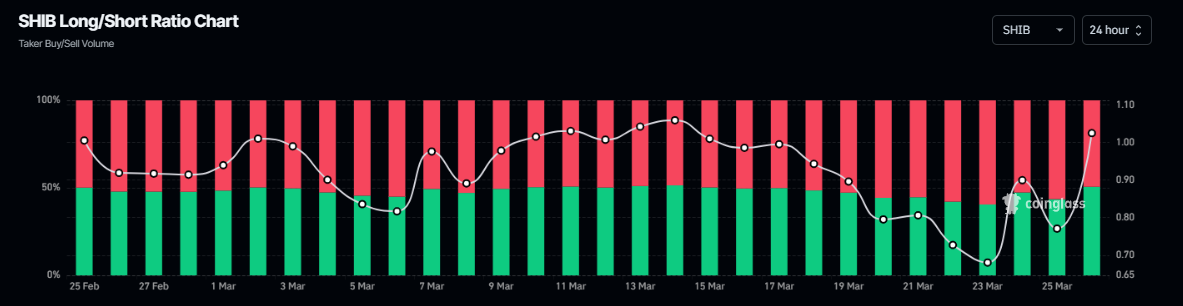
SHIB long-to-short ratio chart. Source: Coinglass
Shiba Inu Price Forecast: SHIB bulls aim for the $0.000016 mark
Shiba Inu’s price broke and found support around a descending trendline (drawn by connecting multiple highs from mid-December) last week. As of this week, SHIB rose nearly 7% until Tuesday. At the time of writing on Wednesday, it trades near $0.000015, scoring over 8% in gains in the day.
If SHIB continues its upward momentum, it could extend the rally to retest its next resistance level at $0.000016.
The Relative Strength Index (RSI) on the daily chart reads 61, above its neutral level of 50, indicating strong bullish momentum. The Moving Average Convergence Divergence (MACD) indicator on the daily chart also showed a bullish crossover last week, giving a buy signal and indicating an upward trend.
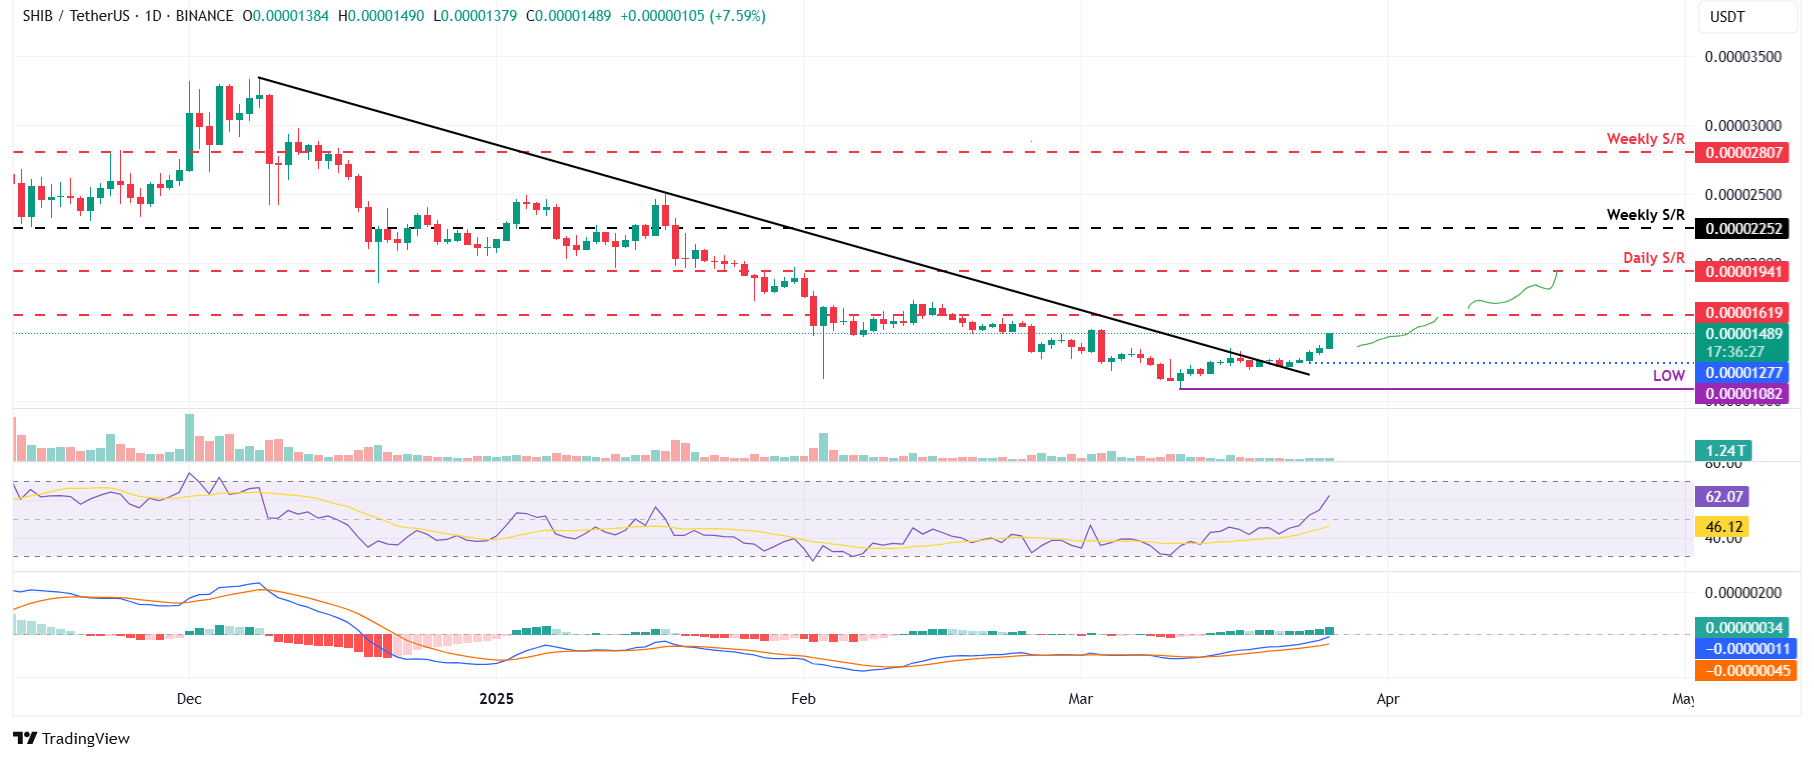
SHIB/USDT daily chart
However, if SHIB declines and closes below Monday’s low of $0.000012, it could extend the decline to retest its March 11 low of $0.000010.
Author

Manish Chhetri
FXStreet
Manish Chhetri is a crypto specialist with over four years of experience in the cryptocurrency industry.


