Top 3 Price Prediction Bitcoin, Ethereum, Ripple: BTC, ETH, and XRP could face volatility as Trump’s “Liberation Day” nears
- Bitcoin price hovers around $87,000 on Wednesday after recovering 4% in the last three days.
- Ethereum price finds support around the $1,861 level, suggesting a recovery on the cards.
- XRP trades around $2.44 on Wednesday after finding support around its 100-day EMA last week.

Bitcoin (BTC) price hovers around $87,000 on Wednesday after recovering 4% in the last three days. Ethereum (ETH) and Ripple (XRP) find support around their key level, suggesting a recovery on the cards. Traders should keep an eye on Trump’s upcoming “Liberation Day” on April 2, with significant tariff announcements, which could trigger increased volatility in the cryptocurrency market due to the potential impact of reciprocal tariffs.
Bitcoin could rally toward $90,000 if its 200-day EMA holds
Bitcoin price broke above its 200-day Exponential Moving Average (EMA) at around $85,556 on Sunday and rose 4.45% until Monday. However, it hovered around the $87,000 level on Tuesday. At the time of writing on Wednesday, BTC still hovers around $87,000.
If BTC finds support around its 200-day EMA, it could extend the recovery to retest the key psychological level of $90,000. A successful close above this level could extend an additional rally toward its March 2 high of $95,000.
The Relative Strength Index (RSI) on the daily chart reads 51, above its neutral level of 50, indicating increasing bullish momentum. The Moving Average Convergence Divergence (MACD) indicator showed a bullish crossover on the daily chart last week, giving a buy signal and suggesting a bullish trend ahead. Additionally, it shows rising green histogram levels above its neutral level of zero, indicating strength in upward momentum.
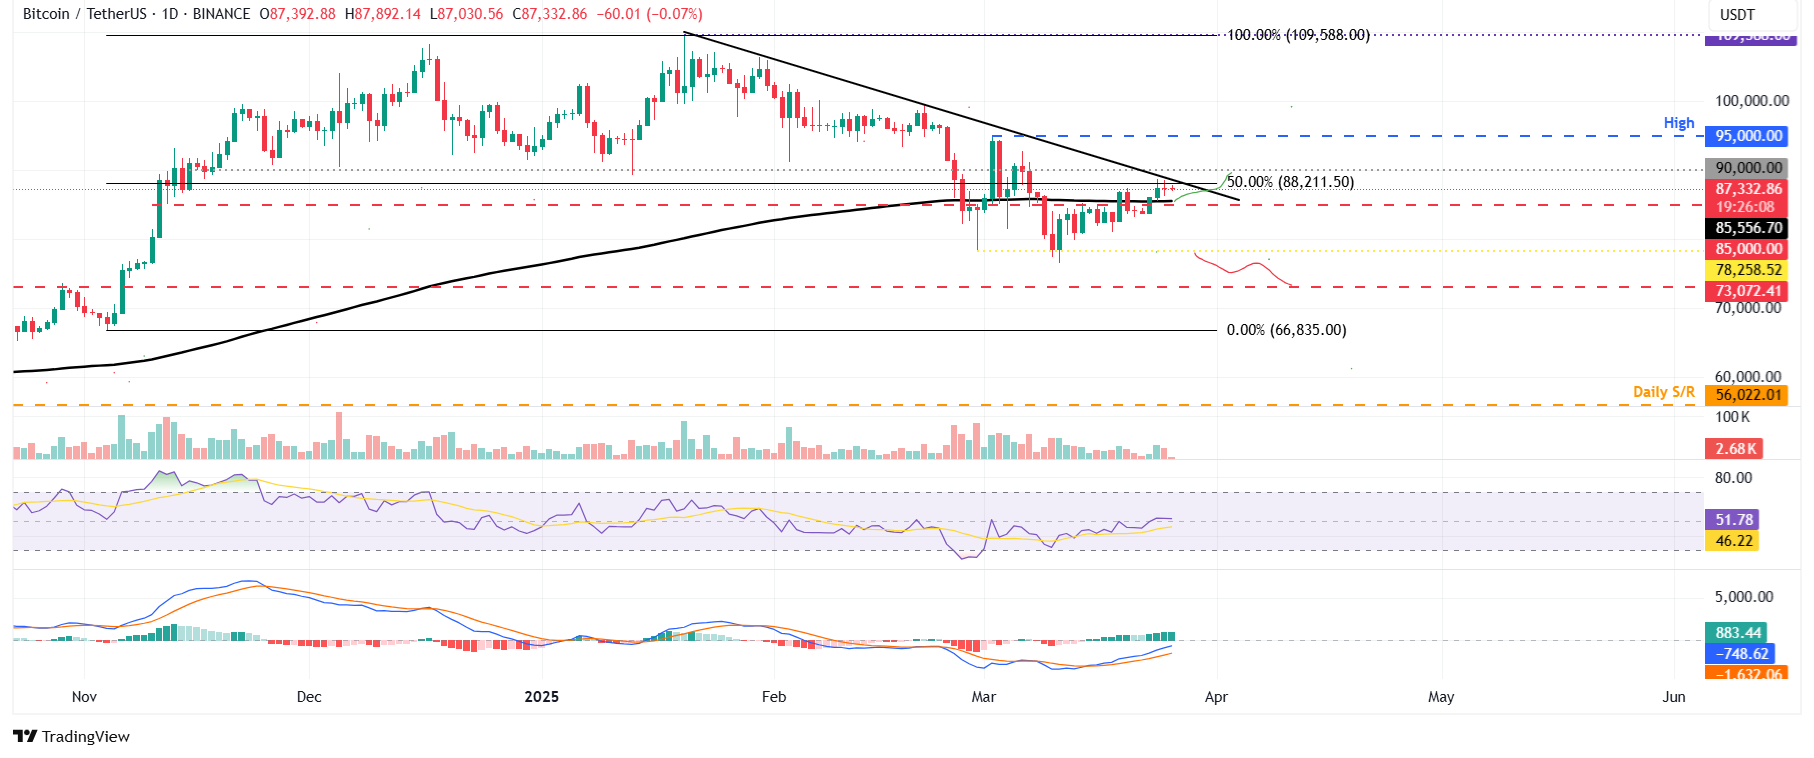
BTC/USDT daily chart
However, if BTC fails to find support around its 200-day EMA and closes below $85,000, it could extend the decline to retest its next support level at $78,258.
Ethereum eyes a recovery if the $1,861 level holds
Ethereum price retested and found support around its daily level of $1,861 for the last two weeks, and it recovered nearly 7% last week. ETH continued its recovery on Monday and closed above $2,081. However, it faced a mild decline on Tuesday. At the time of writing on Wednesday, it hovers around $2,056.
If the daily support around $1,861 holds, the ETH price could extend the recovery to retest its March 7 high of $2,258.
The RSI on the daily chart reads 39, facing rejection from its neutral level of 50 on Monday, indicating bearish momentum. However, the RSI must move above its neutral level of 50 for the recovery rally to be sustained. The MACD indicator showed a bullish crossover on the daily chart last week, giving a buy signal and suggesting a bullish trend ahead. Additionally, it shows rising green histogram levels above its neutral level of zero, indicating strength in upward momentum.
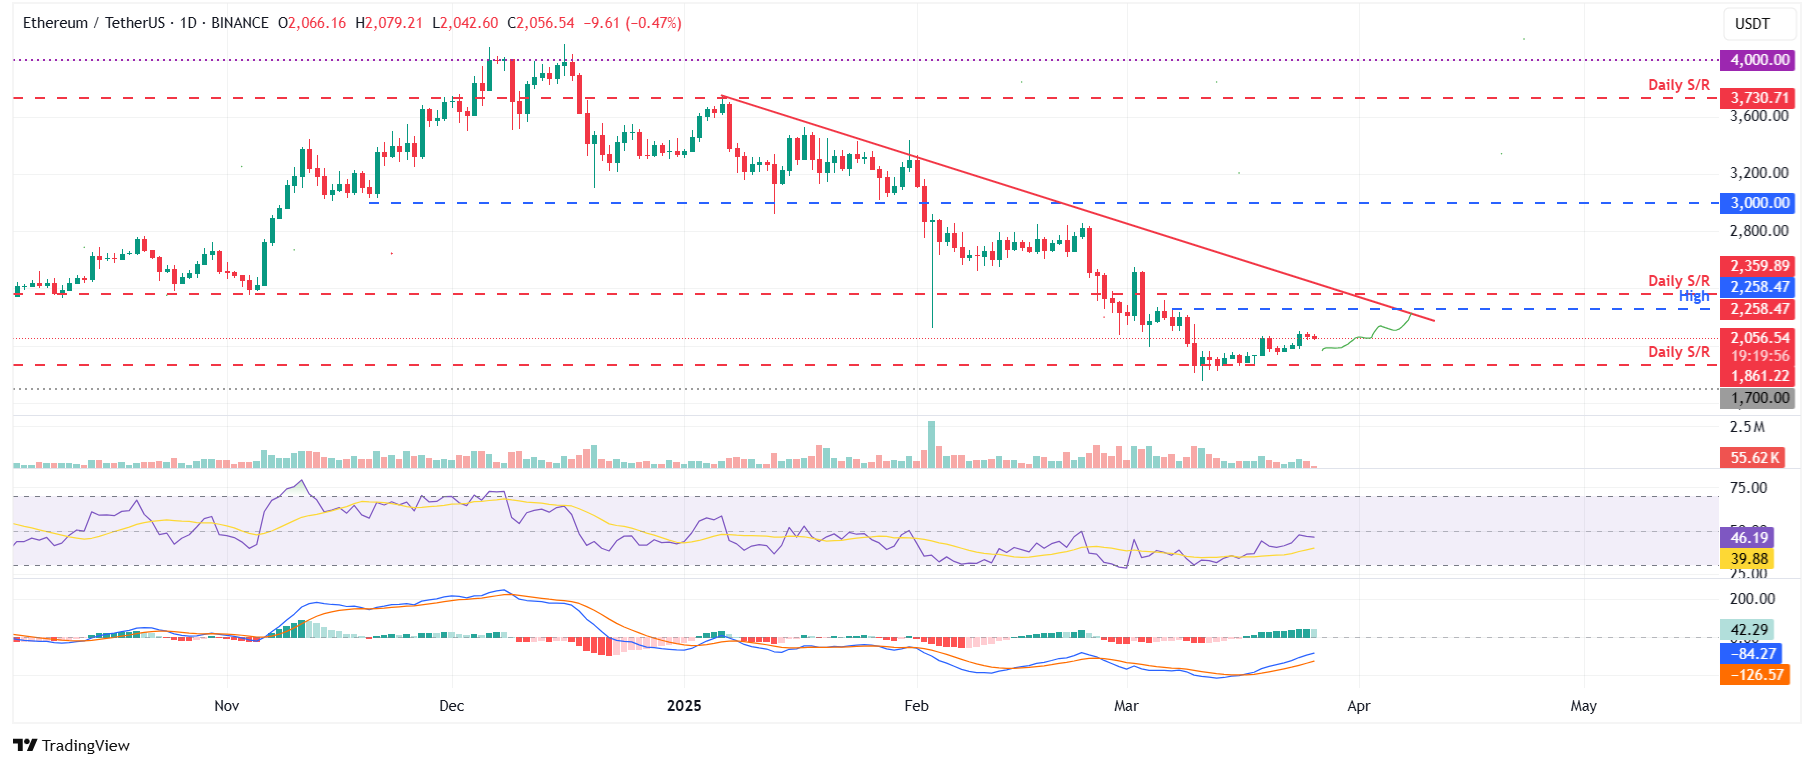
ETH/USDT daily chart
Conversely, if ETH breaks and closes below the daily support at $1,861, it could extend the decline to retest the next support level at $1,700.
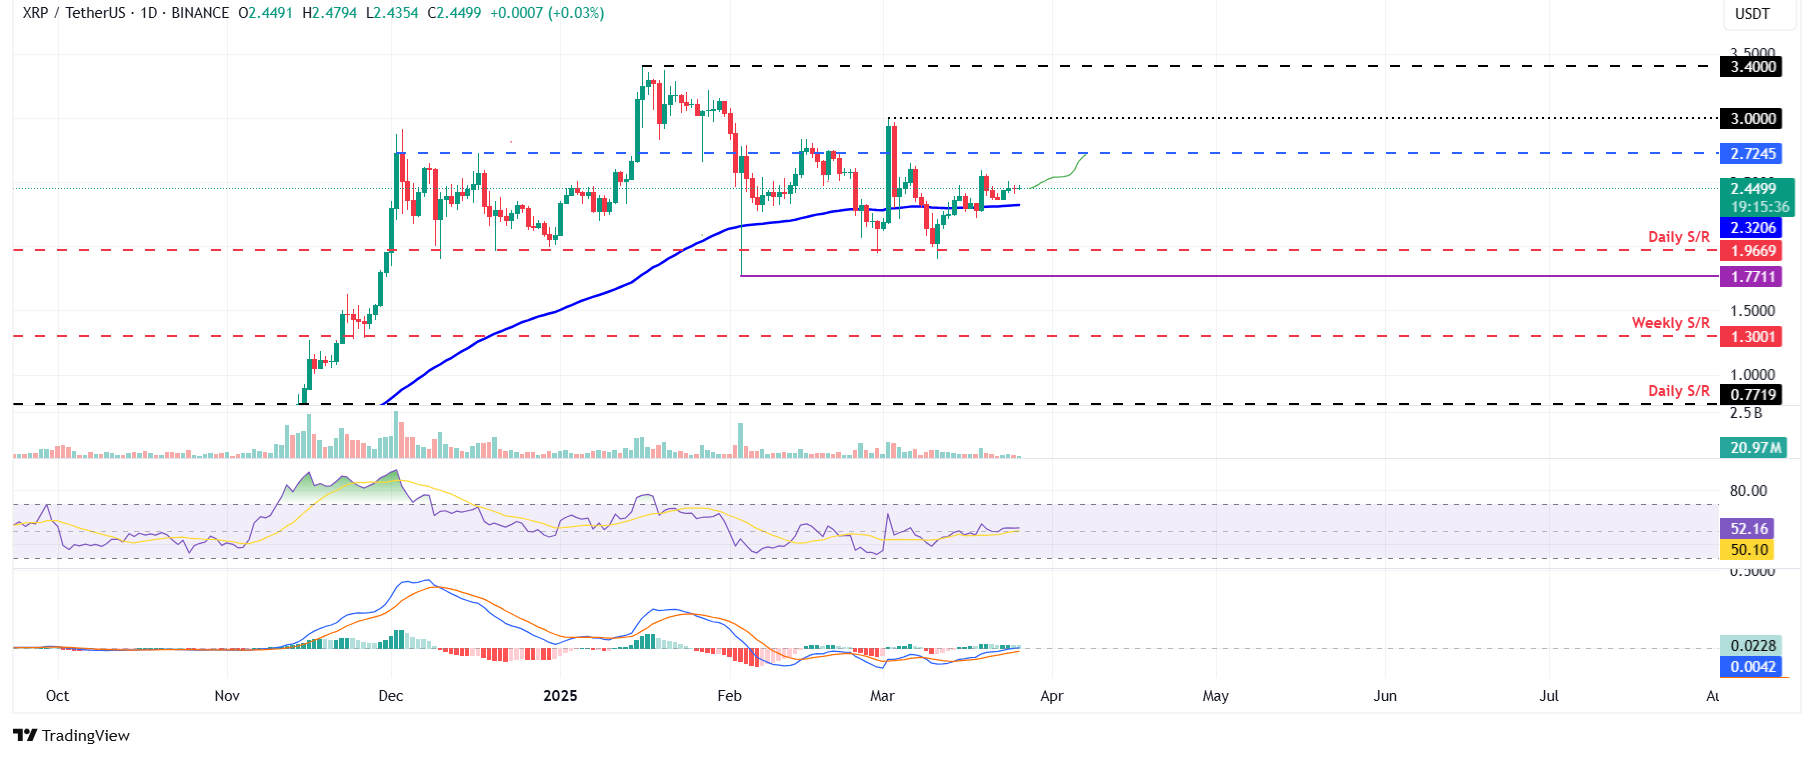
Ripple bulls aim for $2.72 mark
Ripple price broke above its 100-day EMA at $2.32 last week and recovered almost 7%. However, XRP consolidated around its $2.44 level in the last two days. At the time of writing on Wednesday, it hovers around $2.44.
If the 100-day EMA around $2.32 continues to hold, it could extend the recovery to retest its next resistance level at $2.72.
The RSI on the daily chart reads 52, hovering around the neutral level of 50, indicating indecisiveness among the traders. The RSI must point upward and move above its neutral level of 50 to sustain the bullish momentum. The MACD indicator showed a bullish crossover on the daily chart last week, giving a buy signal and suggesting a bullish trend ahead.
XRP/USDT daily chart
On the other hand, if XRP fails to find support around its 100-day EMA and closes below, it could extend an additional decline to test its next support level at $1.96.
Bitcoin, altcoins, stablecoins FAQs
Bitcoin is the largest cryptocurrency by market capitalization, a virtual currency designed to serve as money. This form of payment cannot be controlled by any one person, group, or entity, which eliminates the need for third-party participation during financial transactions.
Altcoins are any cryptocurrency apart from Bitcoin, but some also regard Ethereum as a non-altcoin because it is from these two cryptocurrencies that forking happens. If this is true, then Litecoin is the first altcoin, forked from the Bitcoin protocol and, therefore, an “improved” version of it.
Stablecoins are cryptocurrencies designed to have a stable price, with their value backed by a reserve of the asset it represents. To achieve this, the value of any one stablecoin is pegged to a commodity or financial instrument, such as the US Dollar (USD), with its supply regulated by an algorithm or demand. The main goal of stablecoins is to provide an on/off-ramp for investors willing to trade and invest in cryptocurrencies. Stablecoins also allow investors to store value since cryptocurrencies, in general, are subject to volatility.
Bitcoin dominance is the ratio of Bitcoin's market capitalization to the total market capitalization of all cryptocurrencies combined. It provides a clear picture of Bitcoin’s interest among investors. A high BTC dominance typically happens before and during a bull run, in which investors resort to investing in relatively stable and high market capitalization cryptocurrency like Bitcoin. A drop in BTC dominance usually means that investors are moving their capital and/or profits to altcoins in a quest for higher returns, which usually triggers an explosion of altcoin rallies.
Author

Manish Chhetri
FXStreet
Manish Chhetri is a crypto specialist with over four years of experience in the cryptocurrency industry.


