Shiba Inu price edges closer to a 25% crash
- Shiba Inu price slides closer to retest inclined trend line and the $0.0000118 support level.
- A breakdown of this confluence could trigger a 25% crash to $0.0000093.
- While the short-term outlook is bearish, the downswing could be followed by a 95% rebound to $0.0000179.
Shiba Inu price shows a strong adherence to the immediate support level despite the recent crash. Investors need to be careful, however, as in its current position SHIB could go either way.
Shiba Inu price lacks volatility
Shiba Inu price looks too boring to trade on a lower time frame as it seems to hover mindlessly above the $0.0000118 support level. This has been the case for a little over a month now, in which it has created a string of marginally inclining higher lows.
A support trend line can be drawn using these swing lows and coincides closely with the $0.0000118 support level, creating a confluence. As SHIB edges close to retesting this barrier, it could also provide an opportunity to short, especially if it breaks below.
In such a case, investors can expect Shiba Inu price to trigger a 27% decline to $0.0000093, which is the start of an area of imbalance, aka Fair Value Gap ((FVG), that extends down to $0.0000083.
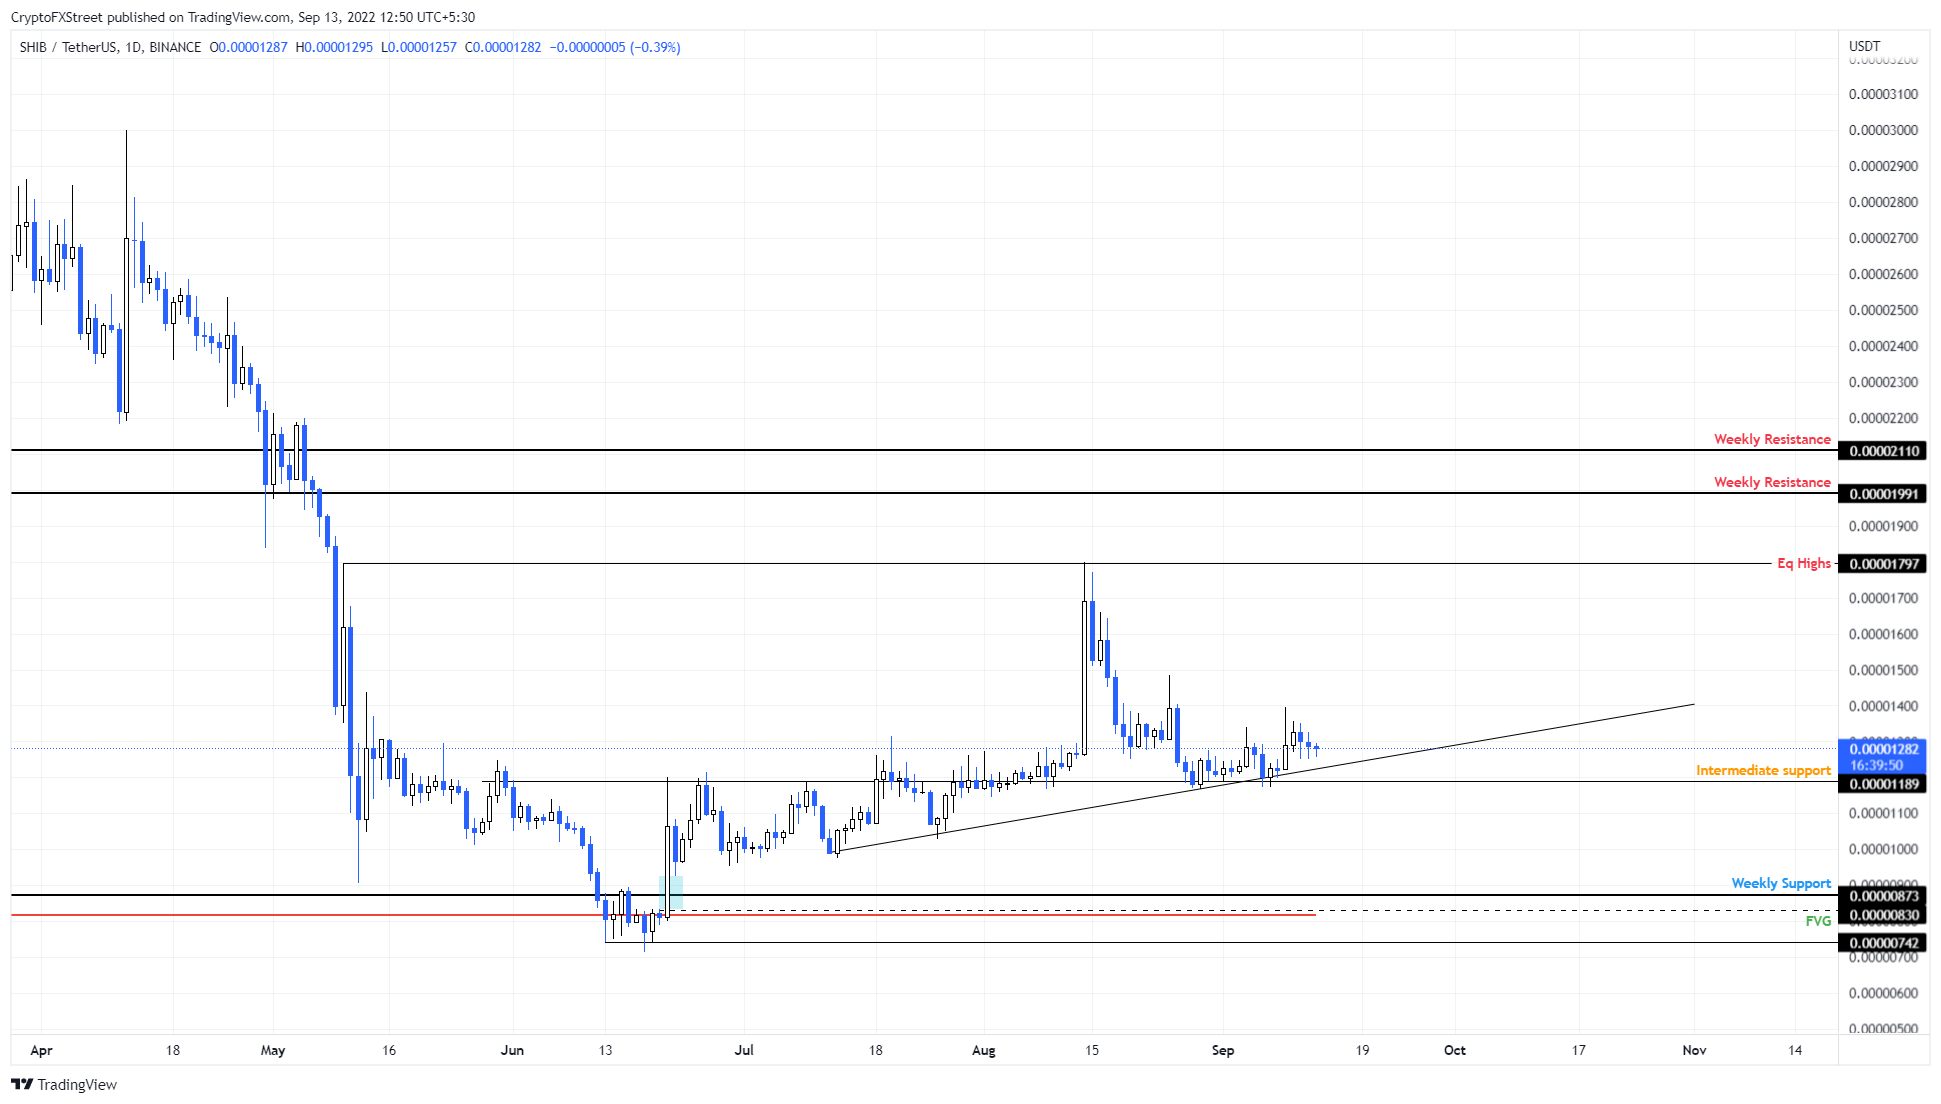
SHIB/USDT 1-day chart
Enter: SHIB and the long game
While the short-term outlook is bearish no doubt, with meme coins such as SHIB investors need to play the long game. Thus, after Shiba Inu price revisits the FVG, extending from $0.0000083 to $0.0000093, traders’ thoughts may turn to the equal highs formed at $0.0000179
From a market makers’ perspective, the buy-stop liquidity resting above the equal highs at $0.0000179 presents a tantalizing next objective. As such, the FVG could provide the perfect buy zone for traders looking to enter the market and speculate on the next bullish move.
If SHIB retests $0.0000179, it will constitute a 95% gain and is likely where the upside could be capped for the dog-themed crypto.
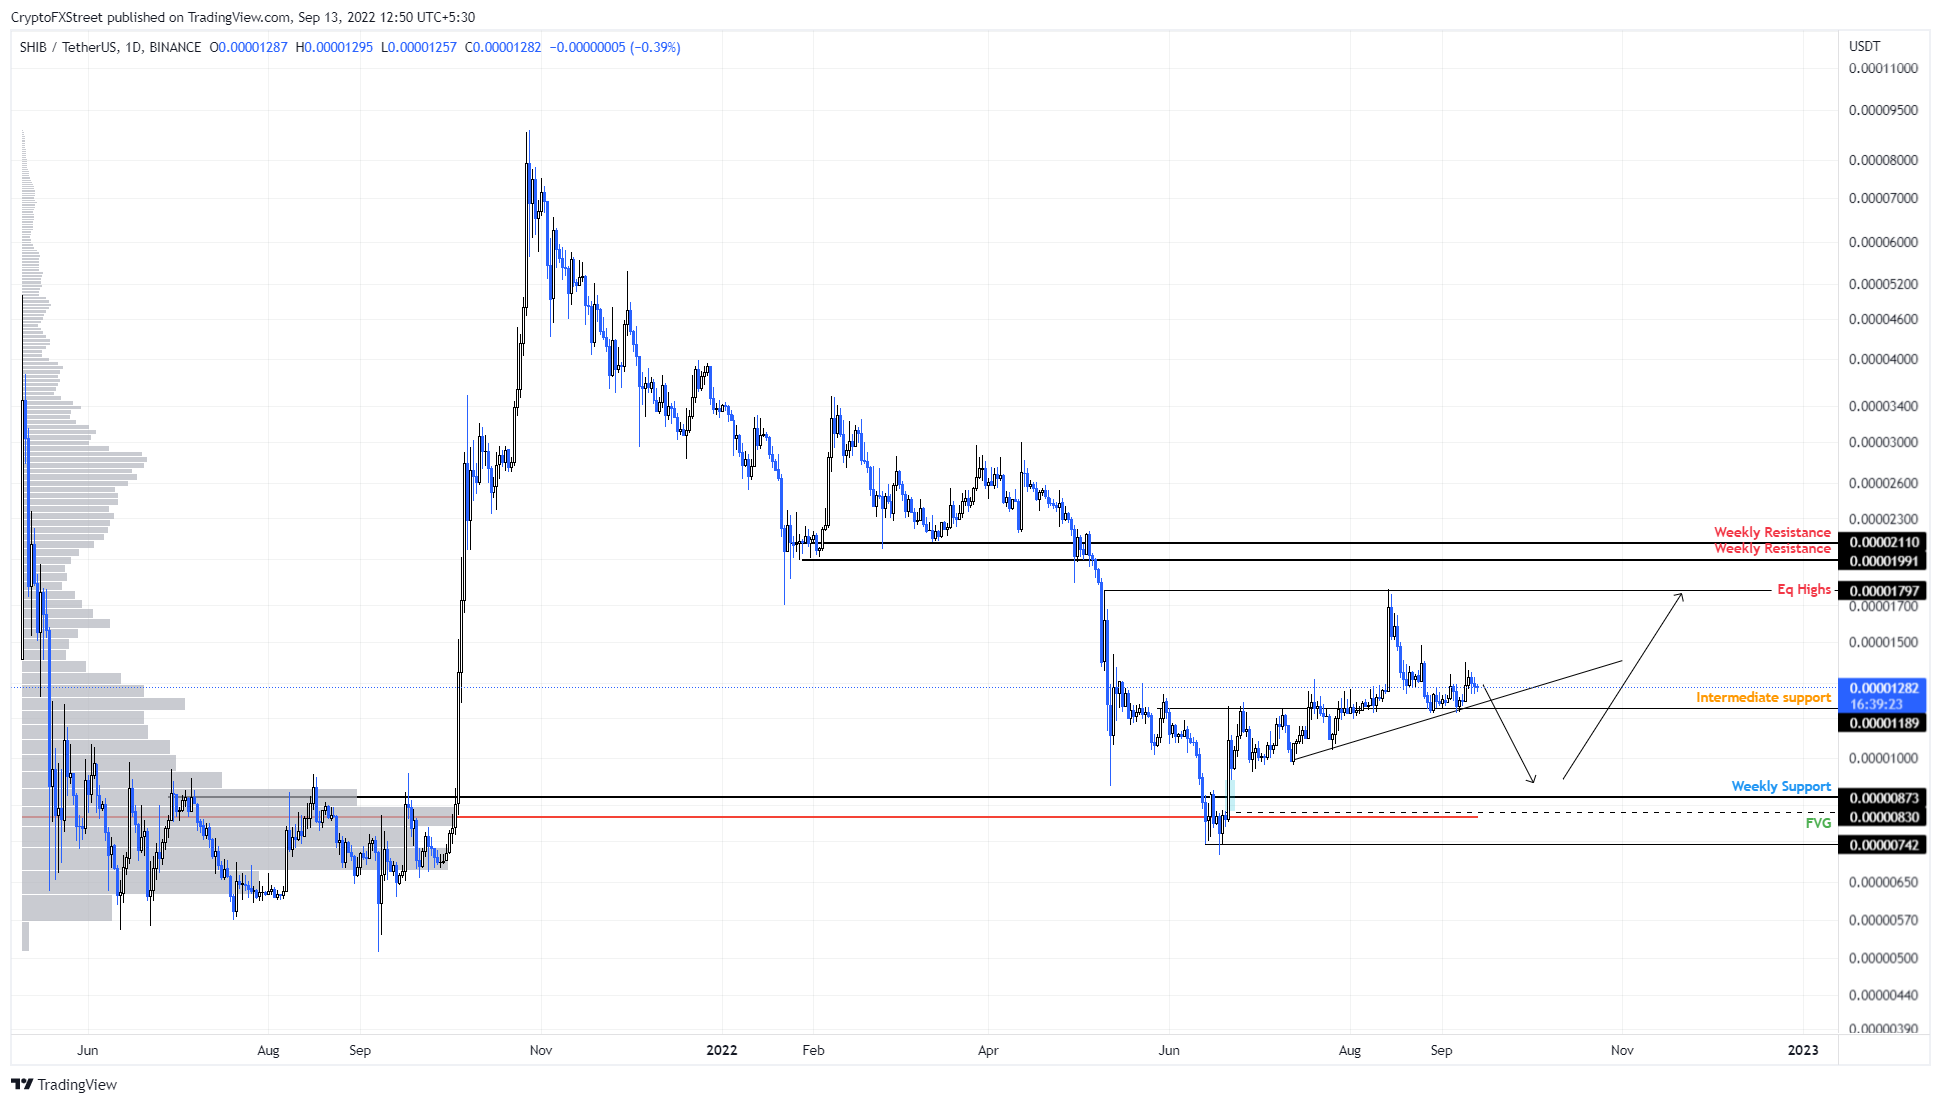
SHIB/USDT 1-day chart
A daily candlestick close below $0.0000087 without a quick recovery will threaten this long-term play. However, a breakdown of the $0.0000083 would invalidate the bullish thesis and potentially trigger a crash to $0.0000074.
Author

Akash Girimath
FXStreet
Akash Girimath is a Mechanical Engineer interested in the chaos of the financial markets. Trying to make sense of this convoluted yet fascinating space, he switched his engineering job to become a crypto reporter and analyst.


