• Shiba Inu is getting squeezed between two forces. 
  • Buyers had an essential historical entry point at $0.00000550.
  • Buyers now face opposition at $0.00000760.

Shiba Inu (SHIB) has been on an upward trend after buyers stepped in and bought back Shiba Inu around $0.00000550, after the correction that went through cryptocurrencies at the beginning of the week. That entry point, $0.00000550, originates from June 12 and has not been tested since, so buyers are right to have picked up some SHIB at these levels.

Further upwards, a real battle has been going on between buyers and sellers. But sellers pulled the short straw and got overtaken by buyers on reclaiming the red descending trend line around $0.00000650. With a perfect retest after the break higher followed by a bounce off that same red descending trend line, buyers are in control of the next ground to reclaim. Price action in SHIB shot through $0.00000760 but has not been able to stay above, or at least get some volume up there, as the thickness of the candles each time resides below $0.00000760.

Shiba Inu would spell more gains

This could spell some issues for Shiba Inu. Price action is getting squeezed in from below with the green ascending trend line pushing prices higher. On the upside, price action seems to retreat below that cap at $0.00000760. SHIB price is thus getting squeezed in a bit, even from both ways, as SHIB cannot make new highs and is even making lower highs for three days now.

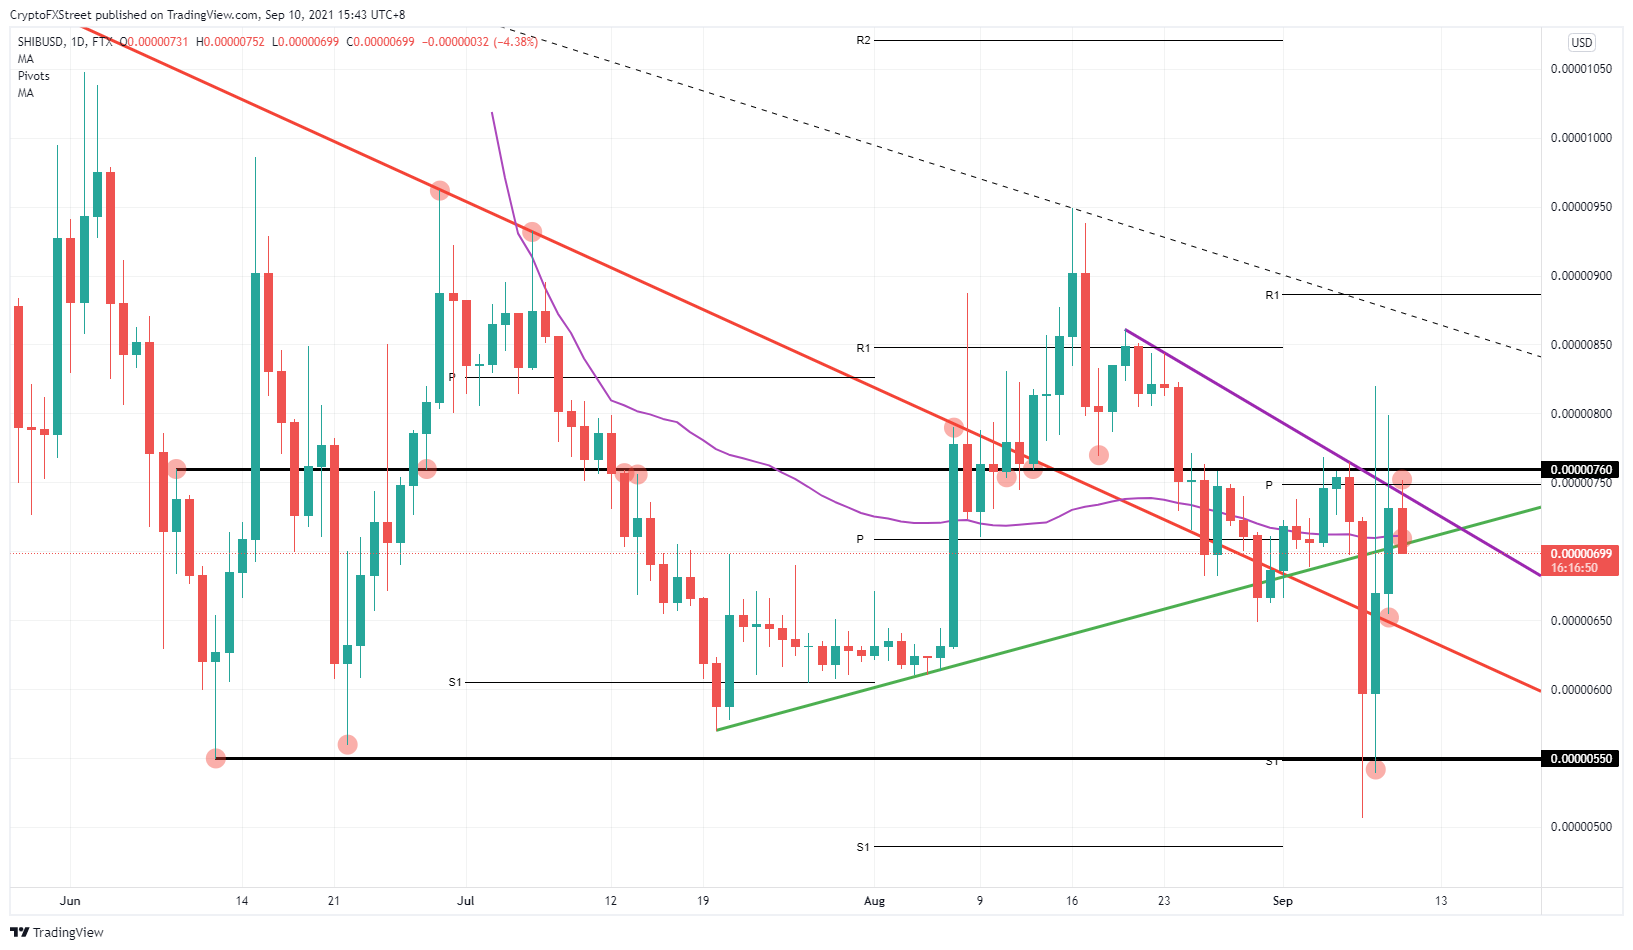
SHIB/USD daily chart

Expect a breakout either way. Seeing the global sentiment and recovery in markets, risk-on switched back on today in the Asia-Pac session. And both European and American index futures seem to follow suit, so expect a push to the upside. A close above $0.00000760 would be very beneficial for price action if buyers can clear that resistance. It is smooth sailing from there toward $0.00000850. That would bring Shiba Inu back toward that dotted descending trend line. 

If SHIB breaks to the downside, expect a retest again on the red descending trend line before another push lower toward $0.00000550. 


Information on these pages contains forward-looking statements that involve risks and uncertainties. Markets and instruments profiled on this page are for informational purposes only and should not in any way come across as a recommendation to buy or sell in these assets. You should do your own thorough research before making any investment decisions. FXStreet does not in any way guarantee that this information is free from mistakes, errors, or material misstatements. It also does not guarantee that this information is of a timely nature. Investing in Open Markets involves a great deal of risk, including the loss of all or a portion of your investment, as well as emotional distress. All risks, losses and costs associated with investing, including total loss of principal, are your responsibility. The views and opinions expressed in this article are those of the authors and do not necessarily reflect the official policy or position of FXStreet nor its advertisers. The author will not be held responsible for information that is found at the end of links posted on this page.

If not otherwise explicitly mentioned in the body of the article, at the time of writing, the author has no position in any stock mentioned in this article and no business relationship with any company mentioned. The author has not received compensation for writing this article, other than from FXStreet.

FXStreet and the author do not provide personalized recommendations. The author makes no representations as to the accuracy, completeness, or suitability of this information. FXStreet and the author will not be liable for any errors, omissions or any losses, injuries or damages arising from this information and its display or use. Errors and omissions excepted.

The author and FXStreet are not registered investment advisors and nothing in this article is intended to be investment advice.

Join Telegram

Recommended content


Recommended Content

Editors’ Picks

PancakeSwap loses nearly 3% value intraday as the DEX crosses $1 billion in trade volume

PancakeSwap loses nearly 3% value intraday as the DEX crosses $1 billion in trade volume

Decentralized exchange (DEX) PancakeSwap (CAKE) announced in an official tweet that it has crossed $1 billion in trade volume on the Layer 2 chain, Base. CAKE on-chain metrics support the thesis of a recovery in the DEX token’s price. 

More Cryptocurrencies News

Shiba Inu hits new milestone, over $9 billion worth of SHIB tokens burnt

Shiba Inu hits new milestone, over $9 billion worth of SHIB tokens burnt

Shiba Inu (SHIB), the second-largest meme coin in the crypto ecosystem, recently hit a milestone in the volume of tokens burned. Shiba Inu has burnt over 410.72 trillion SHIB tokens since the inception of the burn mechanism in the project, worth over $9 billion.

More Shiba Inu News

Dogwifhat crashes 60%, but here's why you should not buy WIF yet Premium

Dogwifhat crashes 60%, but here's why you should not buy WIF yet

Dogwifhat (WIF) price shows a slowdown in the bearish momentum as it sets up a potential range. This development could lead to a good buying opportunity from a long-term perspective. 

More Dogwifhat News

XRP struggles to overcome $0.50 resistance, SEC vs. Ripple could enter final pretrial conference

XRP struggles to overcome $0.50 resistance, SEC vs. Ripple could enter final pretrial conference

XRP is struggling with resistance at $0.50 as Ripple and the US Securities and Exchange Commission (SEC) are gearing up for the final pretrial conference on Tuesday at a New York court. 

More Ripple News

Bitcoin: BTC’s rangebound movement leaves traders confused

Bitcoin: BTC’s rangebound movement leaves traders confused

Bitcoin (BTC) price has been hovering around the $70,000 psychological level for a few weeks, resulting in a rangebound movement. This development could lead to a massive liquidation on either side before a directional move is established. 

Read full analysis

BTC

ETH

XRP