Shiba Inu price back to square one as bull rally gets cut short
- Shiba Inu price action falls back to Monday’s opening levels, making it a week of hardly any gains or losses.
- SHIB price action looks a bit bearish as another broader support test is set to kick in later today.
- SHIB price is still set to tank to $0.00001500 as bearish momentum continues.
Shiba Inu (SHIB) price action retook a step back and pared almost all the gains from Wednesday’s rally. Investors are swinging back into bearish mode as tail risks emerge and are put at the top of the agenda going into the weekend. Conflicting rumours and contrary remarks from what is going on in Ukraine are keeping investors puzzled and refraining them from continuing to open risk-on bets.
Shiba Inu price sees puzzled investors turning their back on crypto
Shiba Inu price action is set to erase its gains from earlier this week. SHIB price rose after the news that peace talks were making good progress. Yet this all looked to be thrown in the bin overnight as several headlines came out about Russiabeing not at all optimistic, and the US even putting the threat of nuclear weapons back on the table, as it sees Russia possibly trying to squeeze out a peace agreement that meets all of its demands but none of Ukraine’s. Shiba Ina and other cryptocurrencies saw bulls repeating the same mistake as last week when they got squeezed out by the weekend.
SHIB price action is again dropping back to the baseline of a longer term triangle with the green trend line as its base. Multiple tests up until now have been held, but with the meeting between Biden and Xi this evening, it looks clear that the US wants to get a clear answer from China as to whether it is with the US against Russia, or with Russia – offering no middle ground. The tail risk from this meeting going into the weekend could trigger a break at $0.00002111 and see a drop towards $0.00001708, the low of January, which could well overshoot towards $0.00001500.
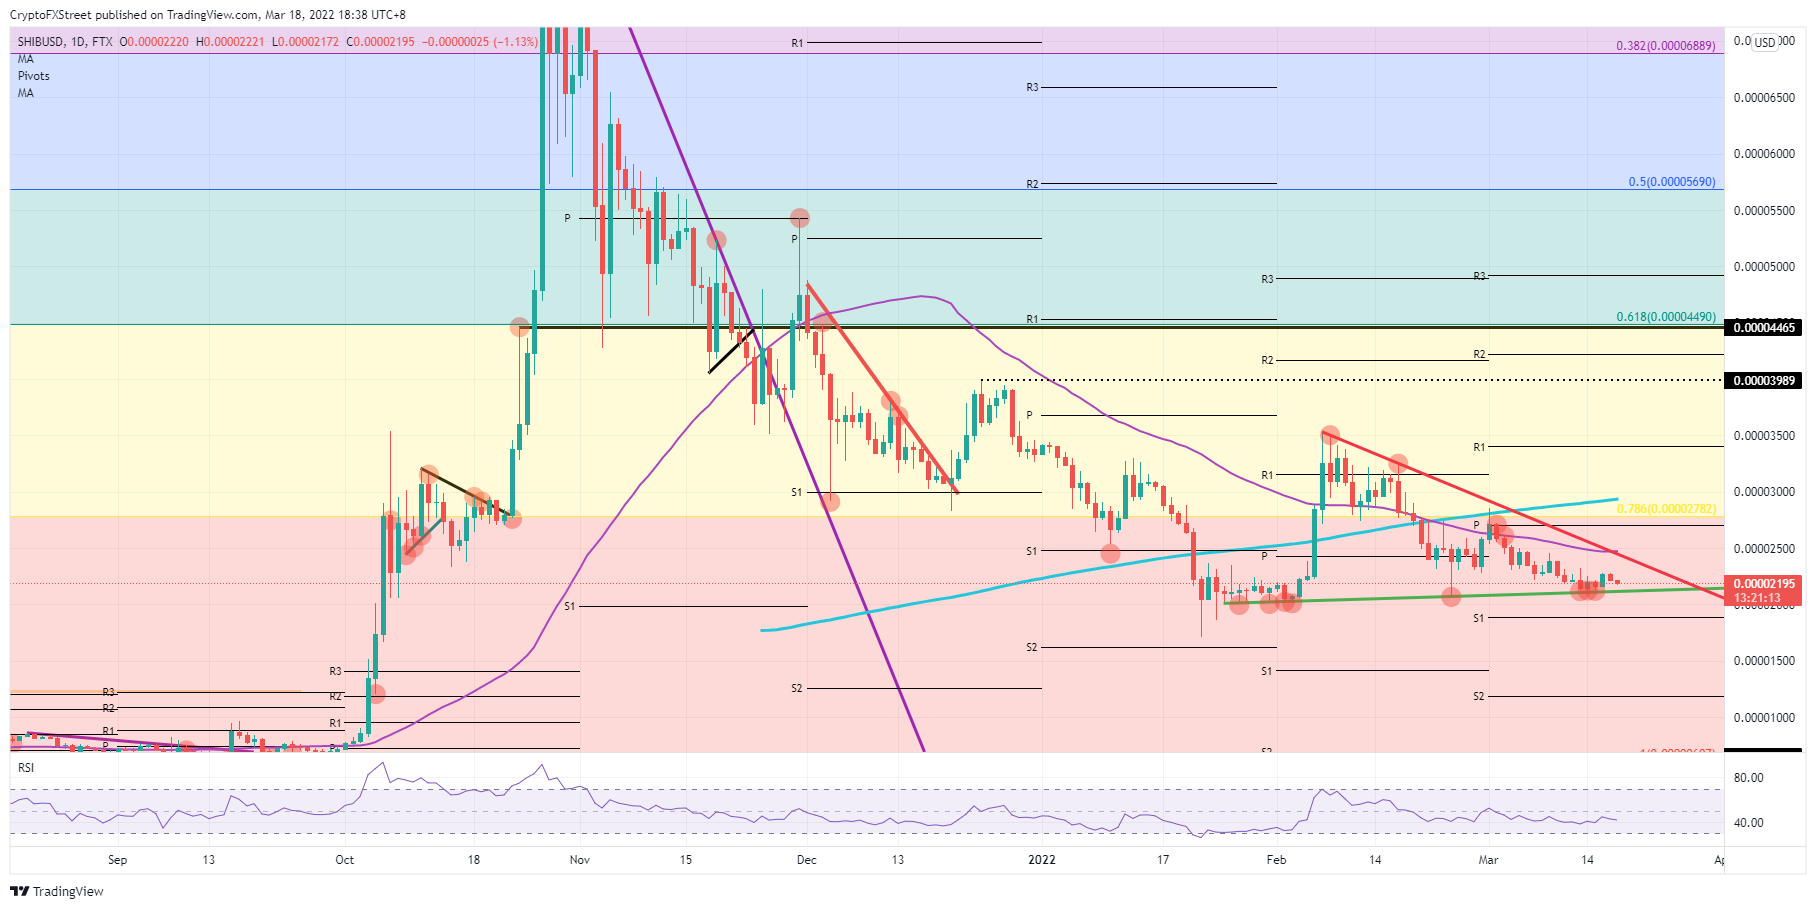
SHIB/USD daily chart
Of course, a truce or ceasefire would help turn the current sentiment around. If that were to happen expect a big pop in price action, capped at a max 13% gain, to where the red descending trend line and side of the triangle intersect with the 55-day Simple Moving Average (SMA) . Yet at the moment this seems an impossible hurdle to break through seeing the weakness of bulls currently at hand.
Author

Filip Lagaart
FXStreet
Filip Lagaart is a former sales/trader with over 15 years of financial markets expertise under its belt.


