Shiba Inu in danger of 'topping signal' as SHIB price loses 50% in 3 weeks
Meme-cryptocurrency Shiba Inu (SHIB) has lost more than 50% of its market valuation in three weeks since its all-time highs in late October.
SHIB price dropped to as low as $0.00004251 on Nov. 19 after correcting by almost 55% from its all-time high of $0.00008854. Its price recovered a small portion of its losses on Friday, but the move looked indecisive due to weaker trade volumes, i.e., not many traders supported the rebound trend.
Some analysts noted that a sharp pullback in the Shiba Inu market was unavoidable after its price skyrocketed by more than 1,100% since Oct. 1.
For instance, an independent market analyst, under the pseudonym John Wick, called SHIB's ongoing price correction a "topping signal," thus suggesting additional selloffs in the sessions ahead.
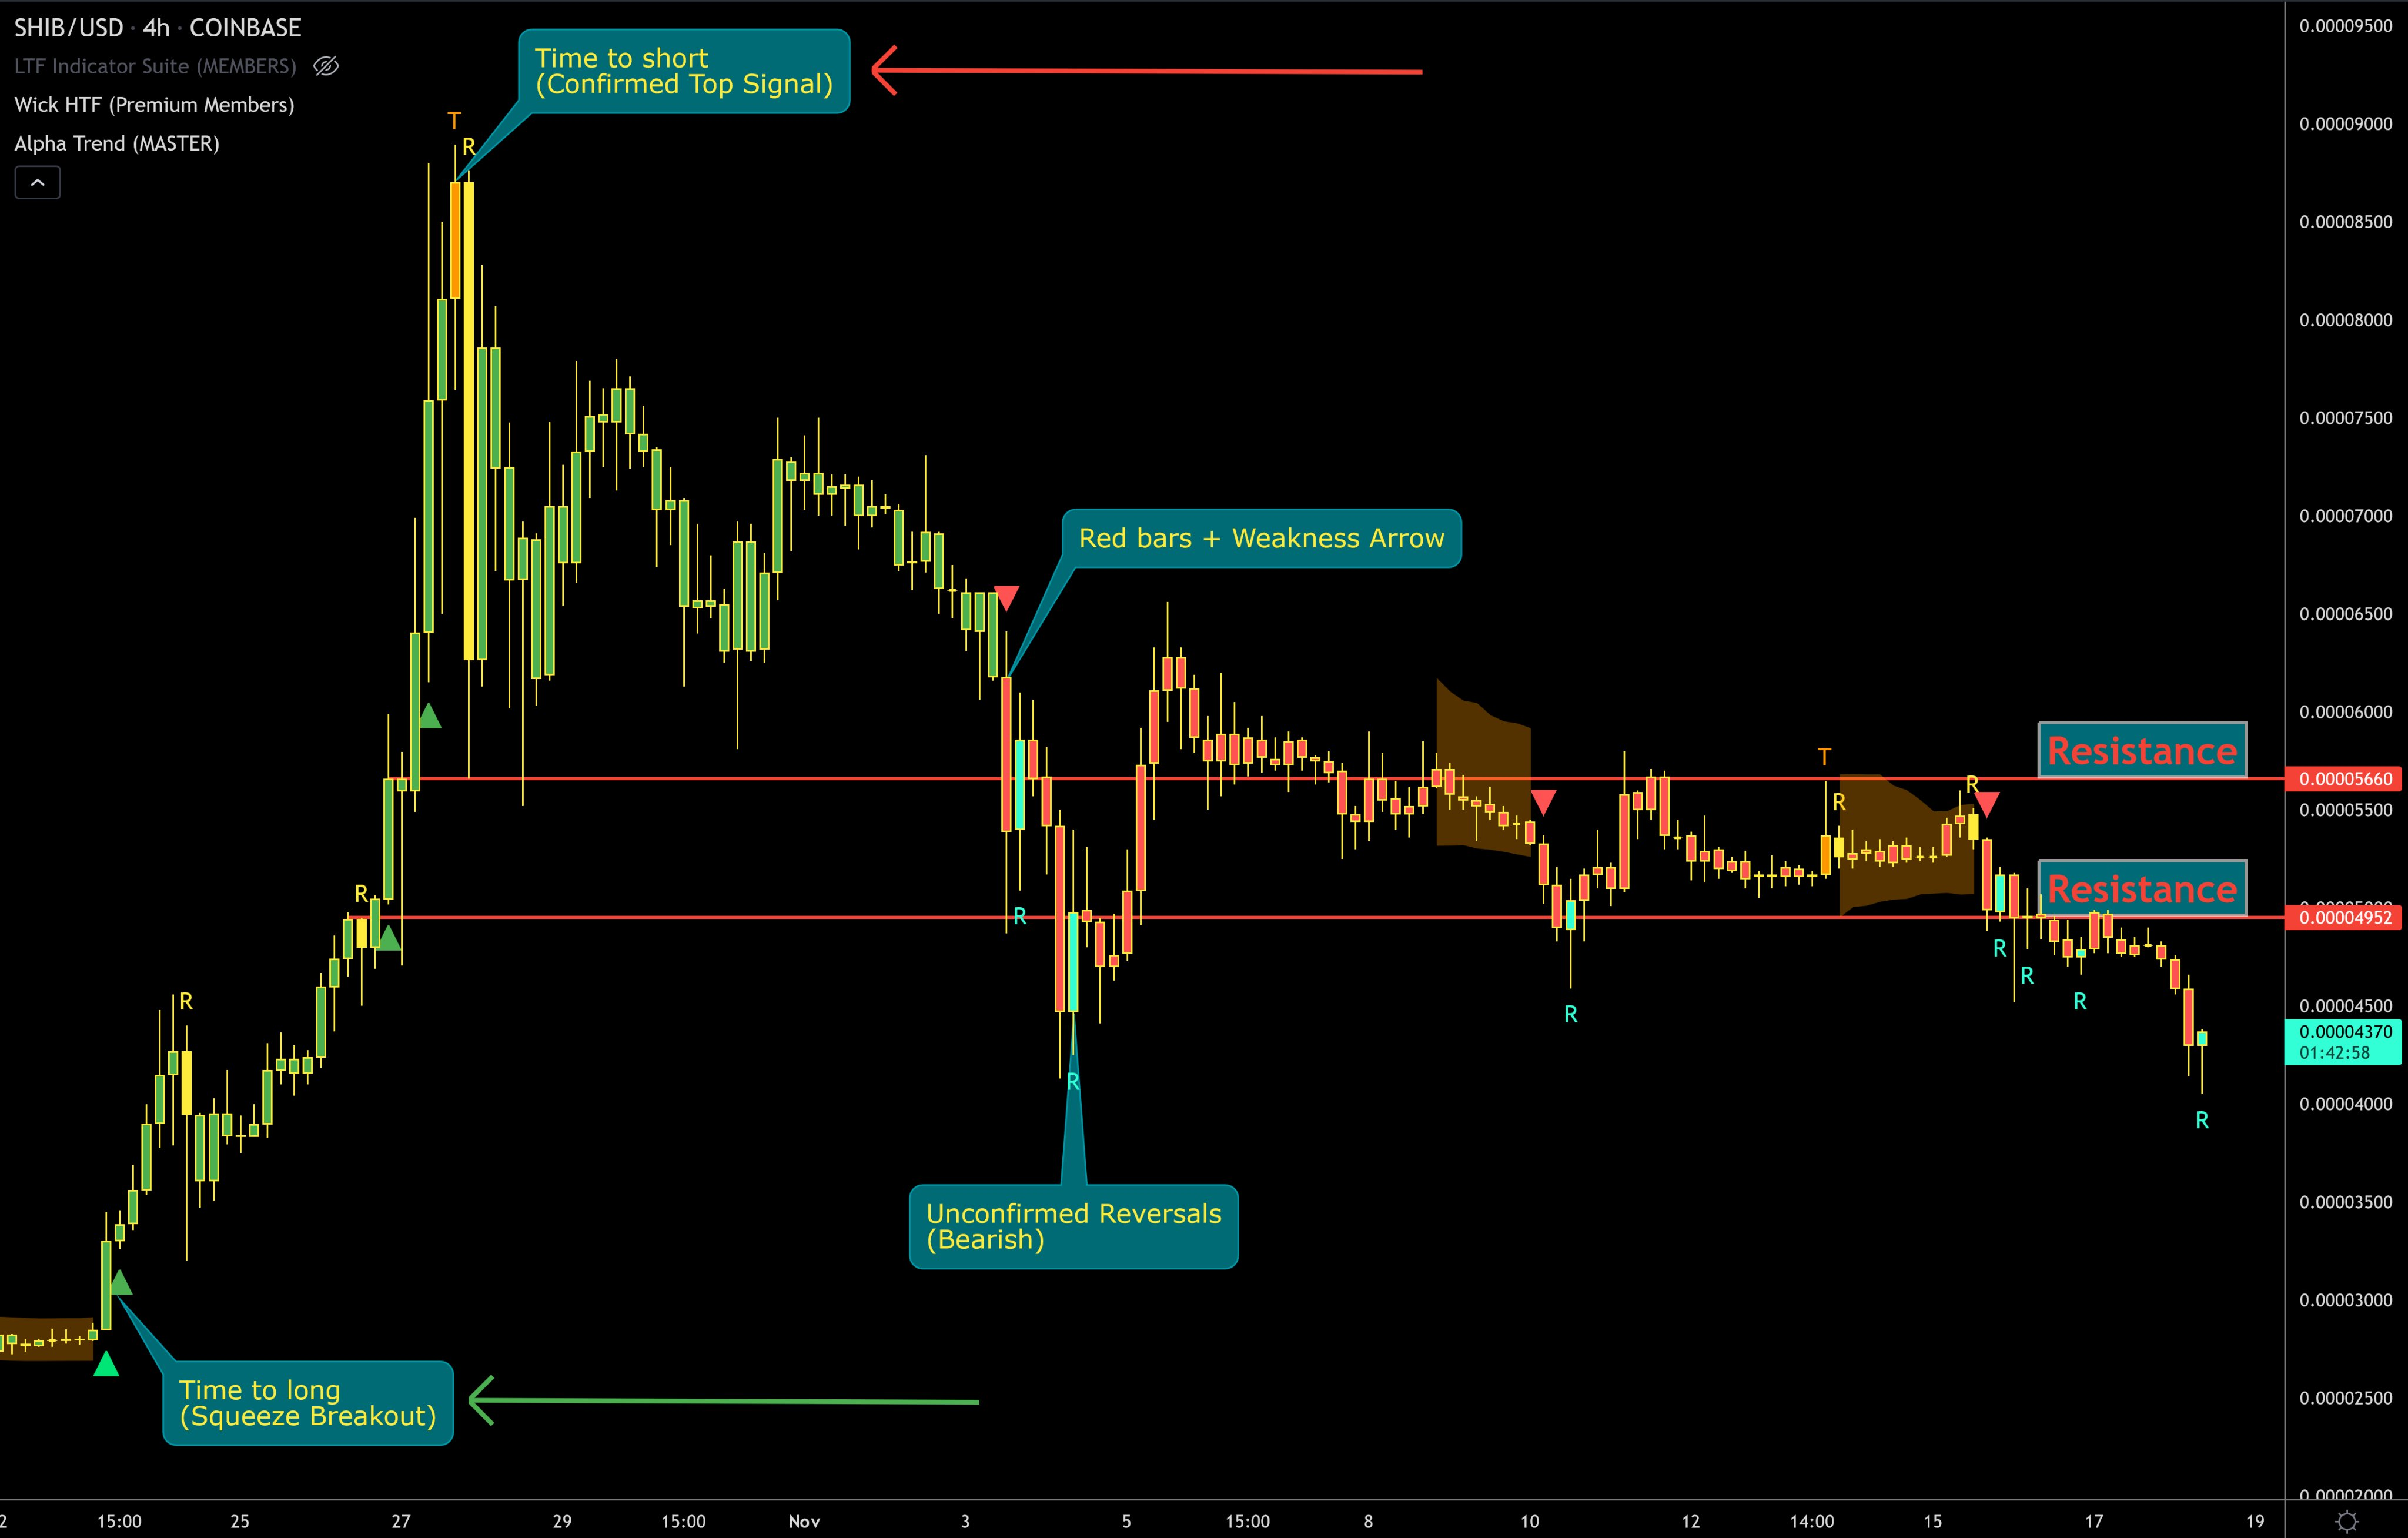
SHIB/USD four-hour price chart. Source: TradingView, John Wick
"Buying the dips"
Price swings of 50% or more are not too uncommon in the cryptocurrency market. For example, Bitcoin had plunged from around $65,000 to below $30,000 in less than thirty days earlier this year. But later, BTC rebounded to establish a new record high at $69,000.
At the core of Bitcoin's volatile rebound was a well-circulated narrative that projected it as a hedge against rising inflation all across the world. Meanwhile, for Shiba Inu, the core bullish narrative remains "community," as stated by one of the coin's most popular endorsers, David Gokhshtein.
The founder of Gokhshtein Media and CEO of PAC Protocol reminded that Shiba Inu's bullish performance this year has come on the back of strengthening community support and despite absence of major endorsements by celebrities and billionaires.
Gokhshtein tweeted Friday asking his followers who among them are "buying the dips," thus also reiterating his faith in a potential SHIB price rebound even after a 50%-plus price correction.
Bul technical outlook
Shiba Inu's ongoing price correction had it trend lower inside what appeared like a Bull Flag range, raising possibilities that the coin would continue its move higher in the future.
In detail, Bull Flags occurs as a brief pause in the trend after a strong price move higher.
The pattern looks like a downward sloping channel/rectangle represented by two parallel falling trendlines. Typically, Bull Flags result in price breaking out of the upper trendline to levels at length equal to the height of the previous uptrend (called Flagpole).
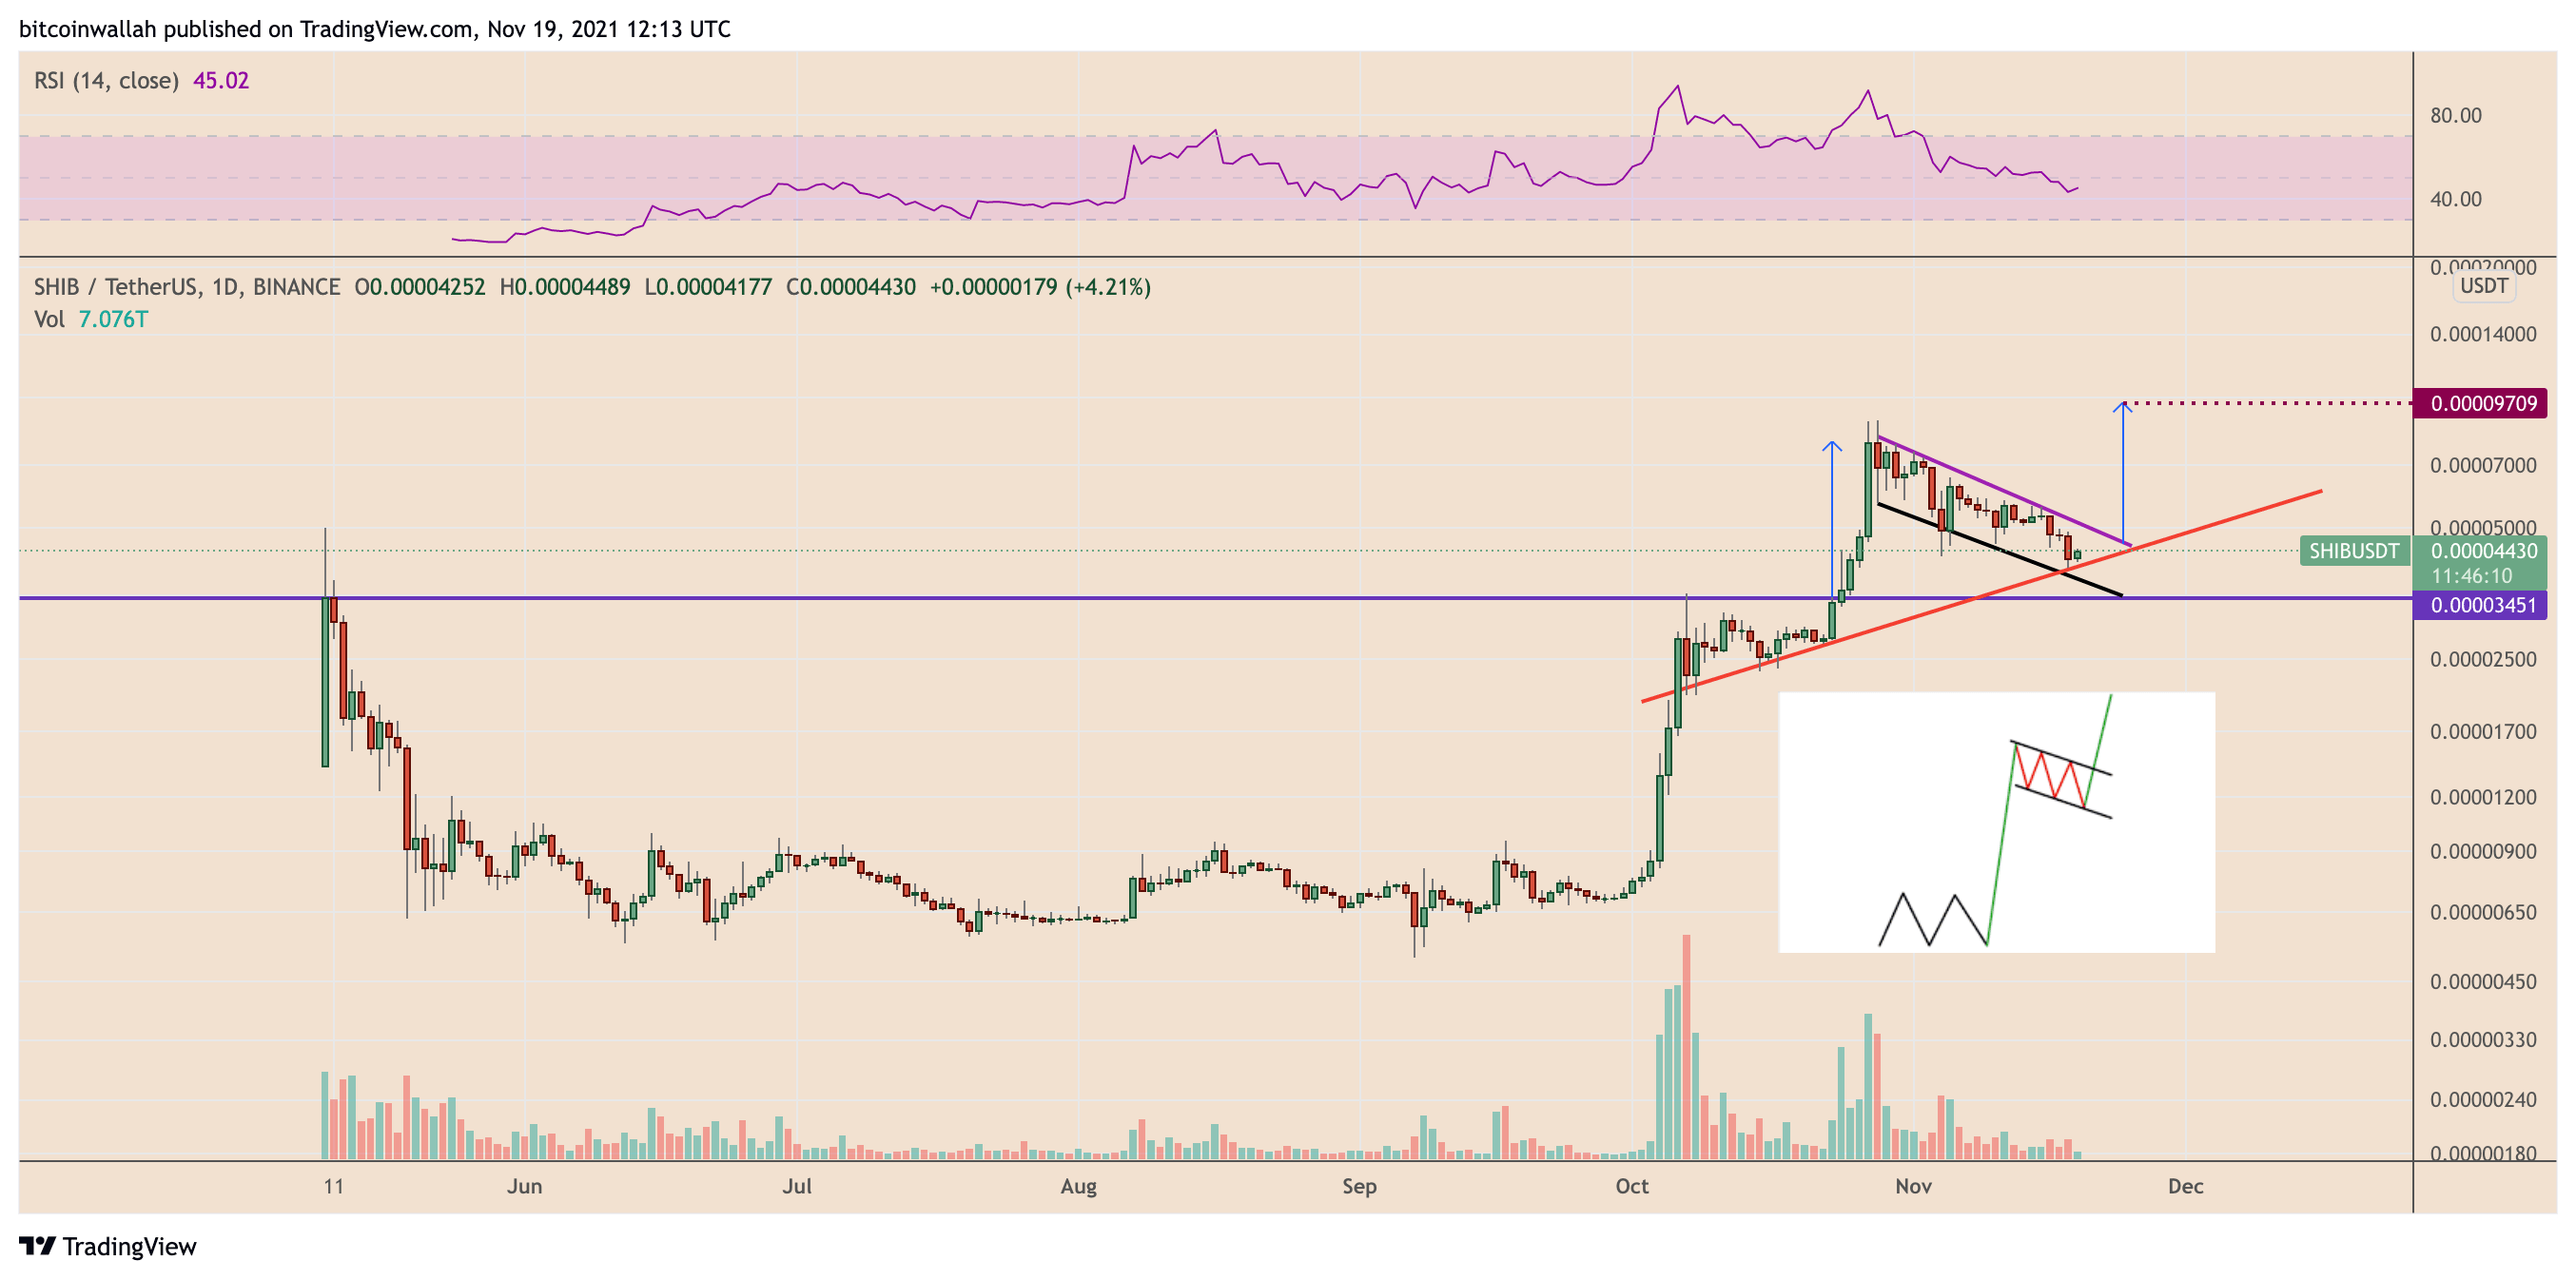
SHIB/USDT daily price chart featuring Bull Flag. Source: TradingView
With that said, SHIB's next attempt to break above its Flag's upper trendline, if accompanied by a rise in trading volume, could result in a price leg higher toward $0.00010000.
Author

Cointelegraph Team
Cointelegraph
We are privileged enough to work with the best and brightest in Bitcoin.


