Sandbox price to test last line of defense before SAND prepares for bullish reversal
- Sandbox price could be headed lower to test a crucial foothold before bouncing higher.
- In order to prevent further losses, SAND must hold above $2.90.
- If Sandbox manages to slice above $4.42, a further 57% climb could be on the bulls’ forecast.

Sandbox price could test a critical level of support before a bounce could be in the offing. SAND must hold above the 200-day Simple Moving Average (SMA) in order for the bullish reversal to be on the radar.
Sandbox price to target $4.43 following test of support
Sandbox price has formed a symmetrical triangle pattern on the daily chart, suggesting that SAND could continue to move sideways within the boundaries of the governing technical pattern.
If bearish sentiment continues to increase, Sandbox price could fall toward the 200-day SMA $2.90, coinciding with the lower boundary of the prevailing chart pattern. Falling below the aforementioned line of defense could put a further 57% decline toward $1.34 on the radar, given by the governing technical pattern.
However, Sandbox price may discover another foothold at the support line given by the Momentum Reversal Indicator (MRI) at $2.30 first.
If the bulls decide to enter the market to reverse the period of underperformance, the first area of resistance will emerge at the 23.6% Fibonacci retracement level at $3.29, then at the 38.2% Fibonacci retracement level at $3.59.
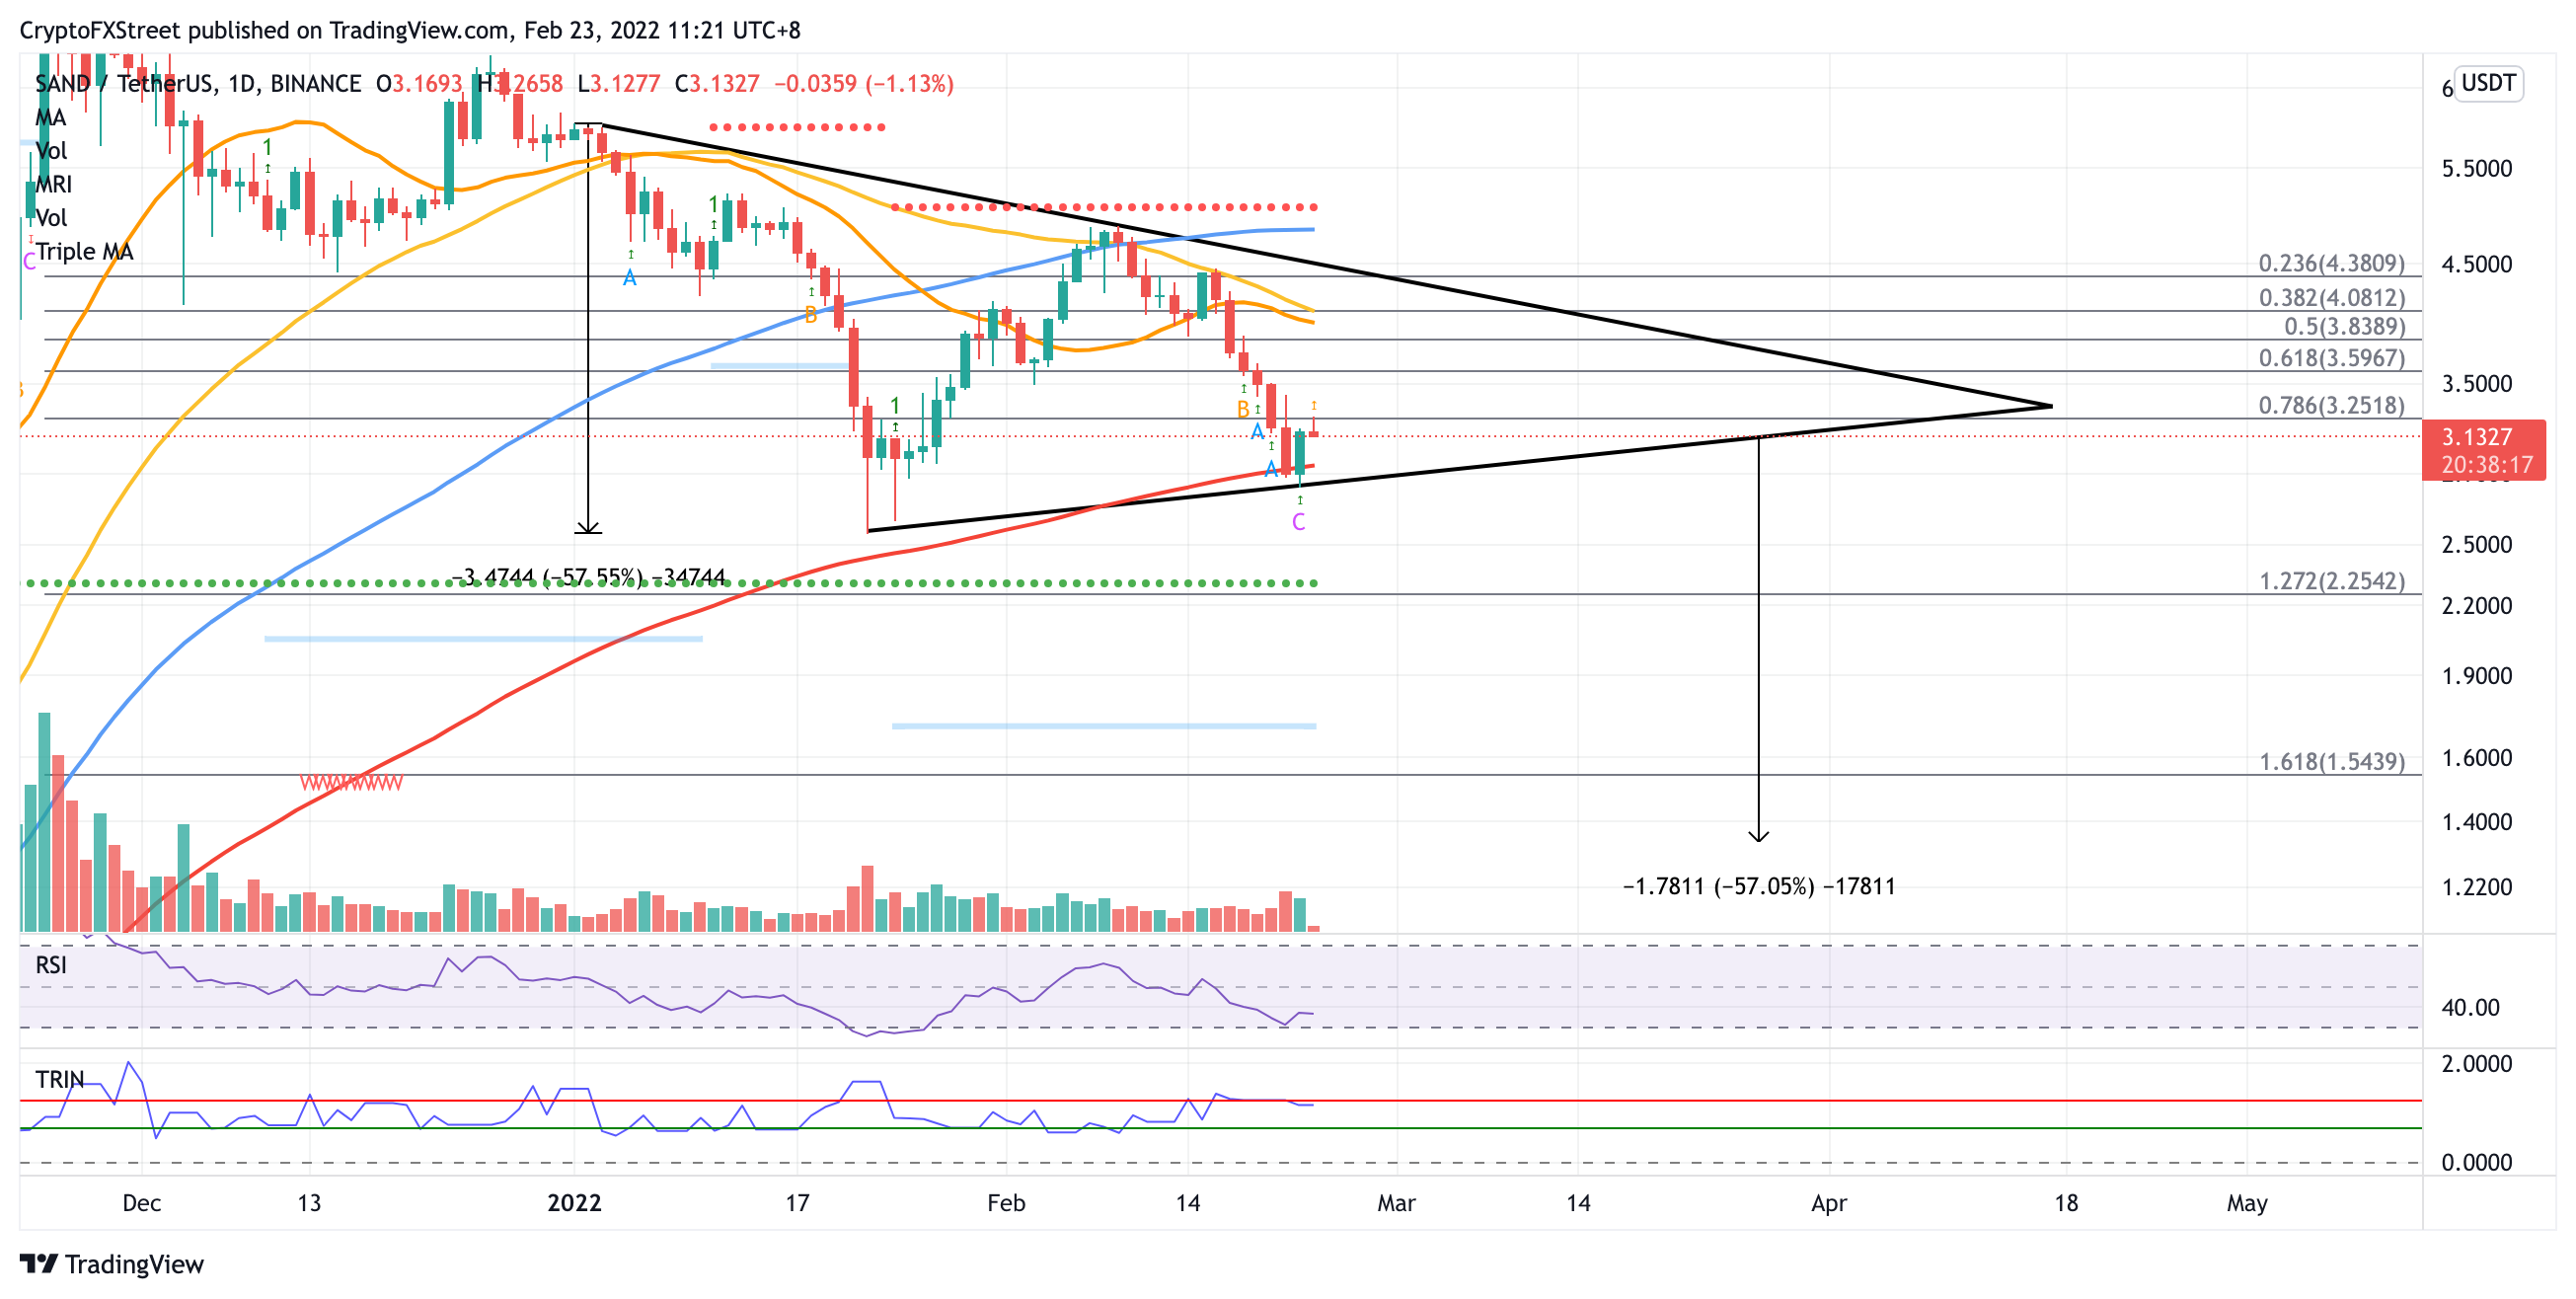
SAND/USDT daily chart
Additional headwinds may appear at the 50% retracement level at $3.83, then at the 50-day SMA at $4.08, coinciding with the 61.8% Fibonacci retracement level.
The most challenging obstacle may emerge at the upper boundary of the prevailing chart pattern at $4.42, intersecting with the 78.6% Fibonacci retracement level. Investors should note that if Sandbox price slices above this level of resistance, a 57% climb toward $6.91 could be in the offing.
Before reaching the optimistic target, Sandbox price may face a hurdle at the 100-day SMA at $4.84, sitting near the resistance line given by the MRI. The 161.8% Fibonacci extension level could at as a headwind for SAND next at $6.13.
Author

Sarah Tran
Independent Analyst
Sarah has closely followed the growth of blockchain technology and its adoption since 2016.