Sandbox price to revisit $4 as SAND confirms bear flag pattern
- Sandbox price remains extremely overbought and has yet to experience a proper correction.
- Capital rotation out of gaming and metaverse-focused cryptos may pressure SAND.
- A mean reversion to the $4 value area is expected.

Sandbox price action warns that downside pressure remains a genuine risk in the short term. Today is the ninth consecutive day it has traded below the Tenkan-Sen and the fourth consecutive day below the Kijun-Sen.
Sandbox price breaks below bear flag and bounces to test the breakout
Sandbox price has faced a frustrating range of trading throughout the week. The initial reaction to last week’s flash crash was an astounding reversal that saw Sandbox close above its open while most of the market suffered double-digit percentage losses. However, that was not enough to generate any sustained momentum higher.
Prices continue to fall in a reasonably steady manner. Sandbox broke down below a bear flag on its $0.05 3-ox reversal chart and faced some intense selling pressure until buyers stepped in during the early Friday trading session. Bulls are attempting to test the conviction of sellers by making a move to test the breakdown below the bear flag.
If the retest of the breakout is successful, then traders should expect a swift move towards the most recent swing low at $5. A slight pause may occur due to the psychological nature of the $5 level. But any break below $5 is likely to generate violent and rapid selloffs of Sandbox price.
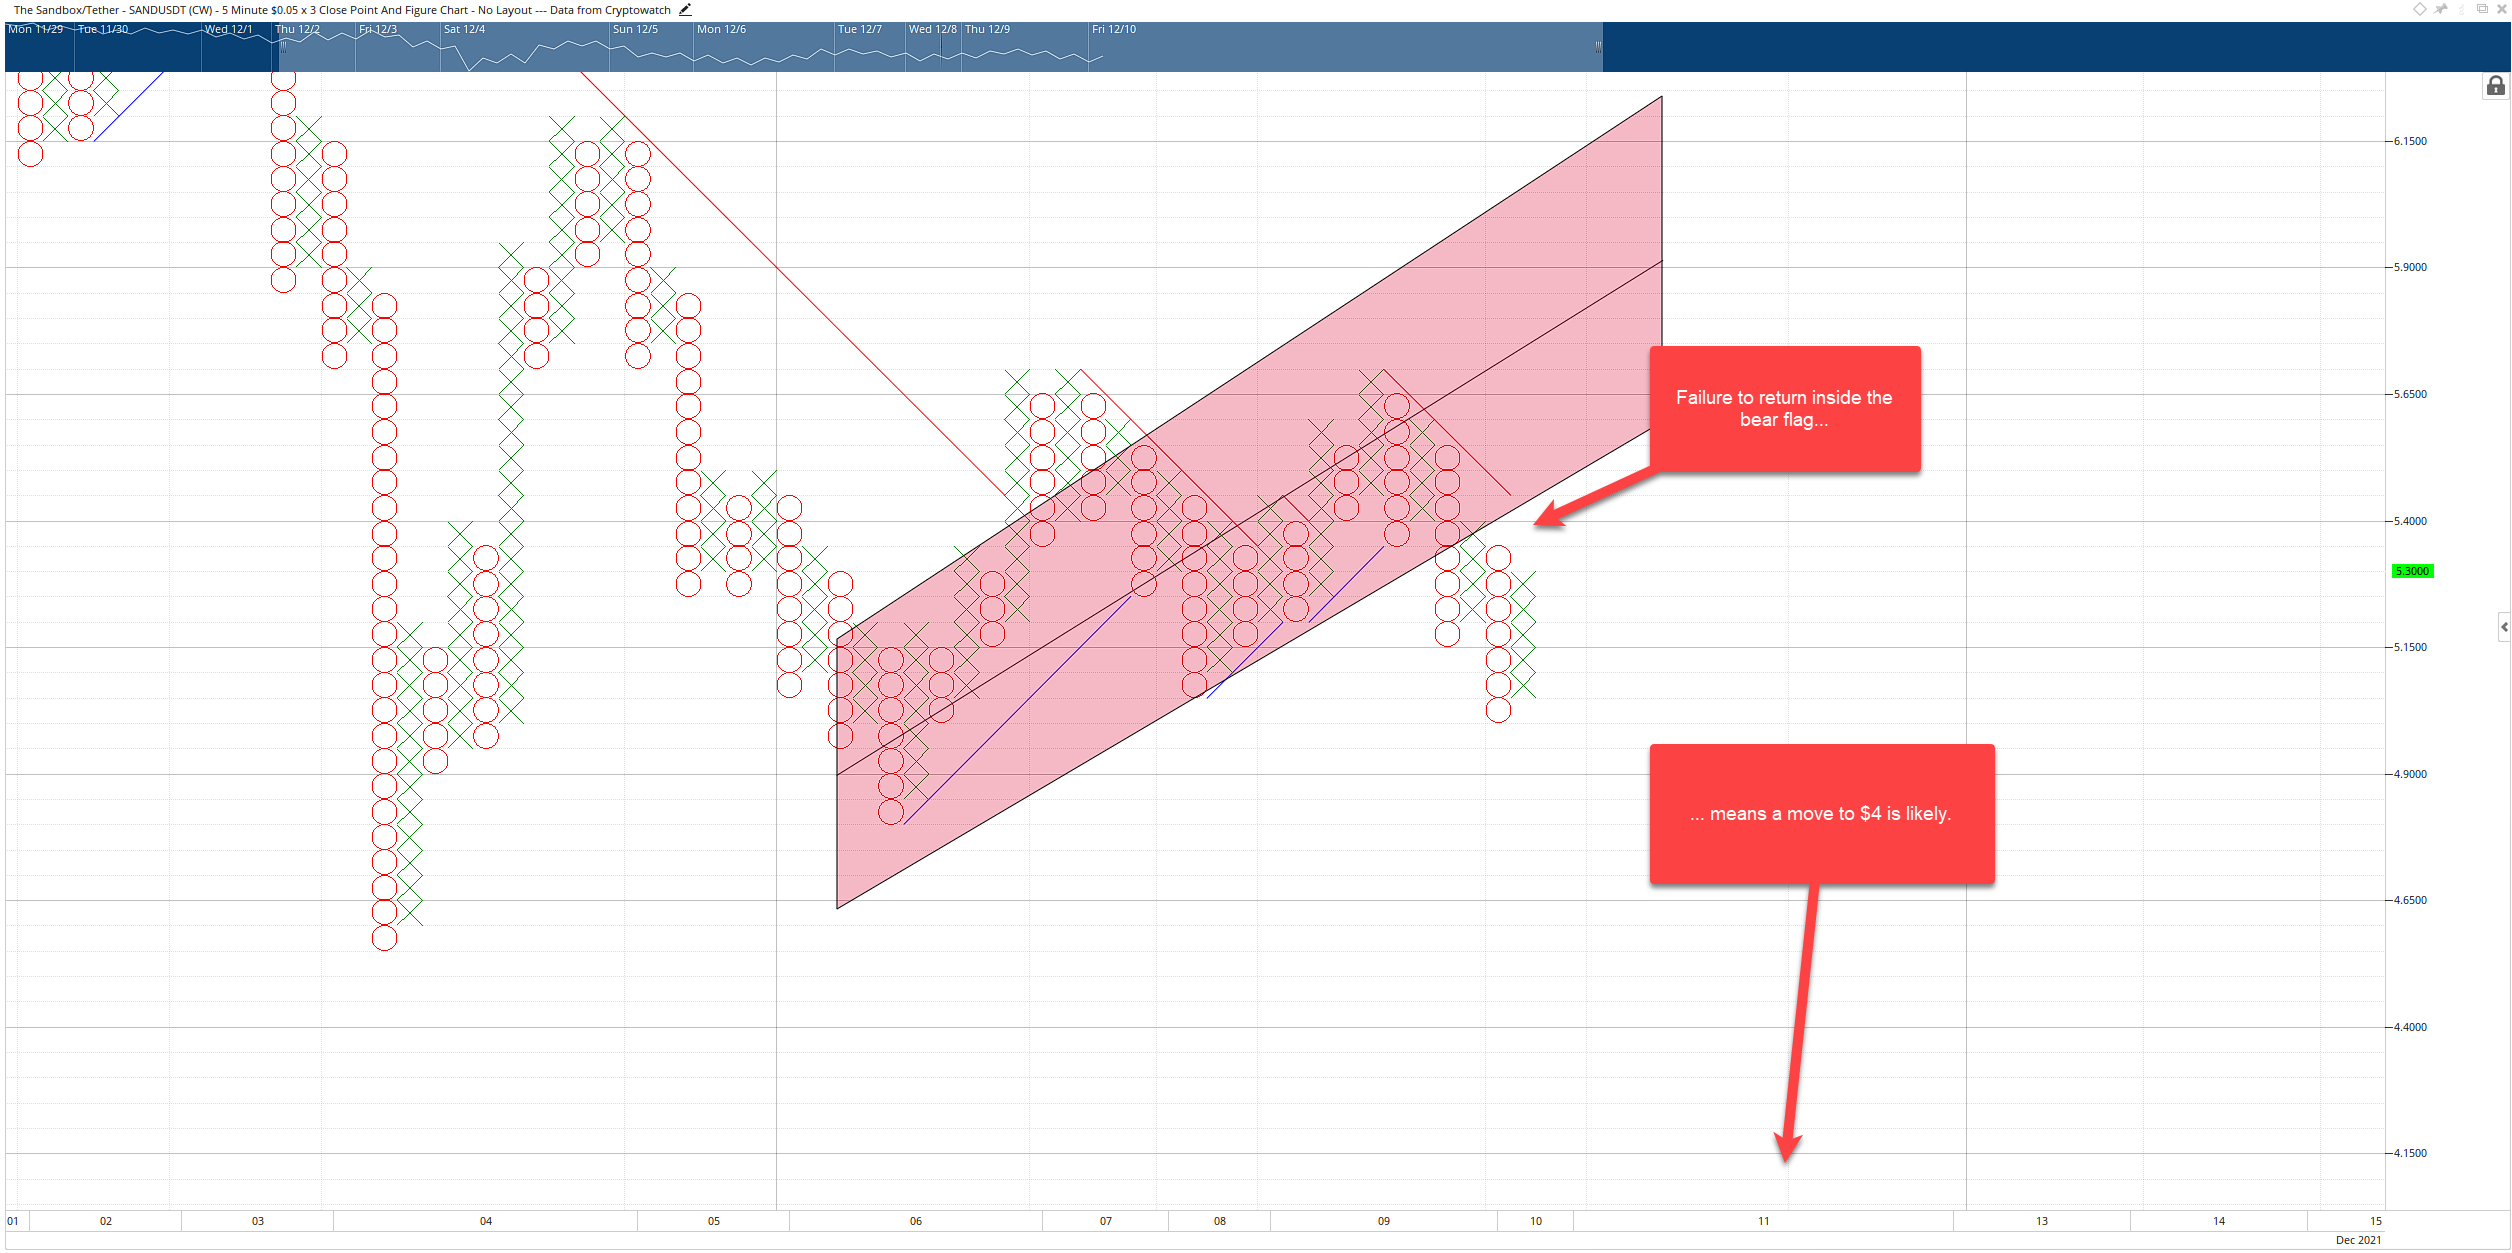
SAND/USDT $0.05/3-box Reversal Point and Figure Chart
Resistance for Sandbox price buyers will be a combination of the bear market trendline and the bottom of the bear flag channel at the psychological number of $5.50. A daily close at or above that level could trap any sellers stuck below the bear flag and entice buyers on the sidelines to re-enter.
Author

Jonathan Morgan
Independent Analyst
Jonathan has been working as an Independent future, forex, and cryptocurrency trader and analyst for 8 years. He also has been writing for the past 5 years.


