Sandbox makes a bullish uptick and is set to recover incurred losses
- The Sandbox sees bulls preparing for a breakout trade above the monthly pivot.
- SAND price pops above the red descending trend line and looks ready to mount a recovery backup to $8.0.
- Expect further bullishness if SAND price closes above the monthly pivot at $5.70.

The Sandbox (SAND) is making a recovery following the violent correction last week. Since touching down on support at $4.0 on December 4, bulls have slowly but surely been repurchasing a stake in the cryptocurrency and look to break the downtrend anytime soon. A daily close above the monthly pivot would attract more investors and speed up the recovery back towards $8.0, from which new all-time highs are just 10% away.
The Sandbox falls back into the lap of bulls as positive signs emerge
The Sandbox gave way to the bears last week as pressure to the downside started to outweigh buying volume. The Relative Strength Index was trading too far in the overbought zone too, limiting further upside gains for investors joining the party too late. The absence of new bulls triggered a profit-taking frenzy that saw an acceleration over the weekend as a result of the Bitcoin falling knife spillover effect.
As SAND saw bulls returning to the scene, buying continued during the recovery this past week. Bulls keep buying alongside the green ascending trend line and are now breaking out of a pennant pattern, trying to take control of the monthly pivot at $5.70. A close above would encourage hesitant investors to start buying in as it would prove that this rally is strong and viable.
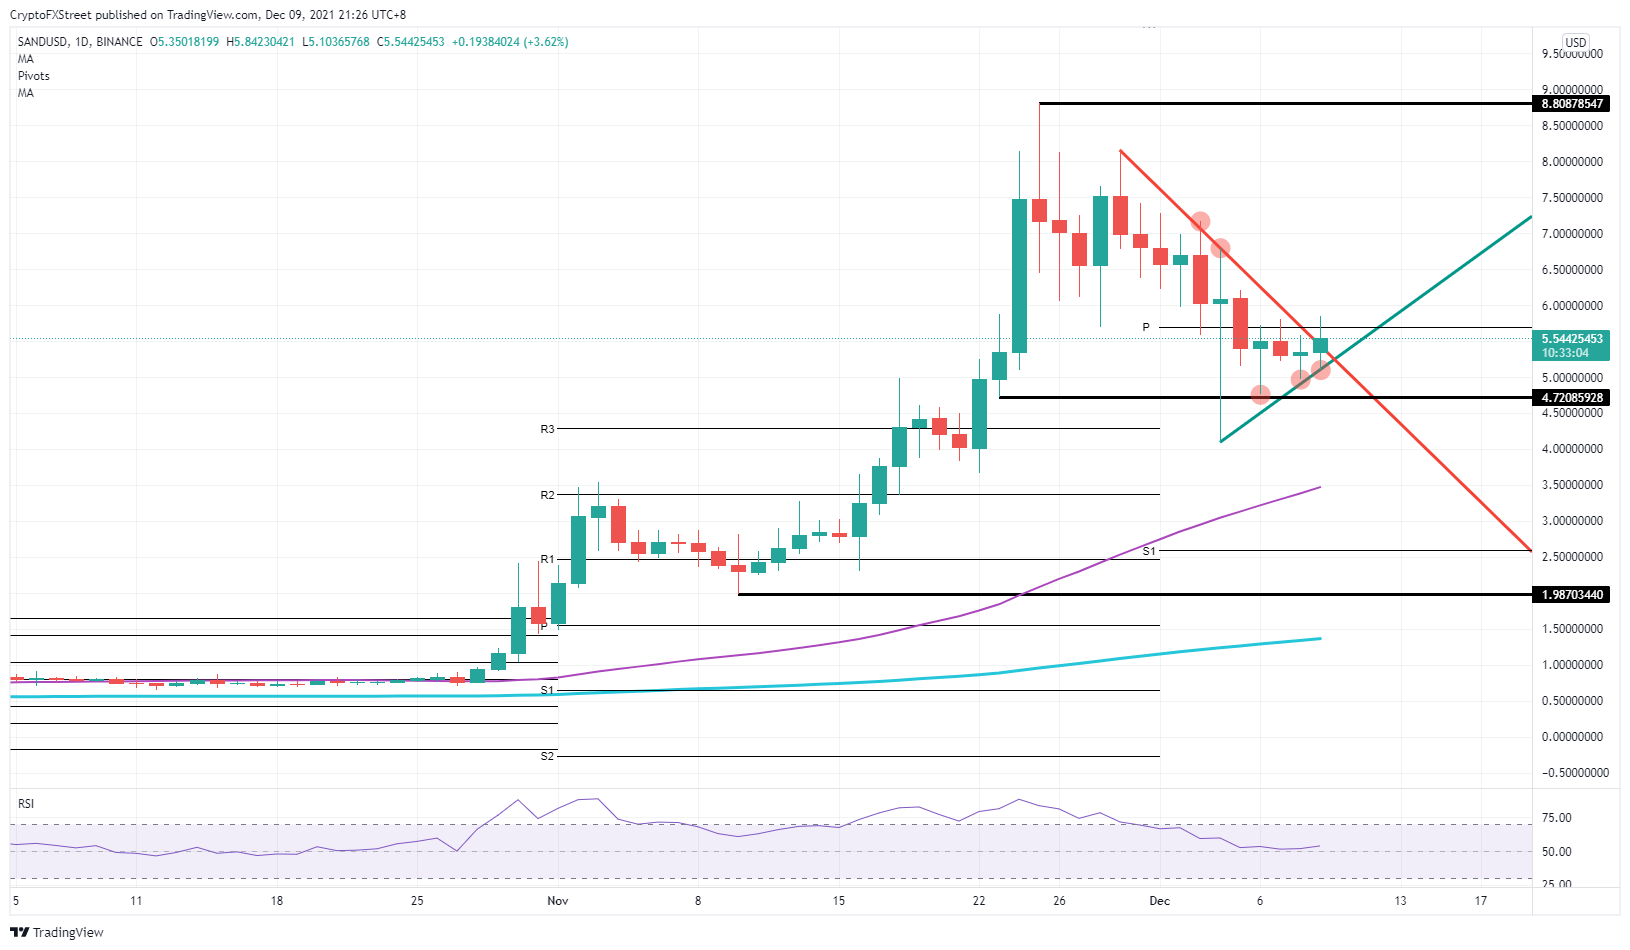
SAND/USD daily chart
With the close above the monthly pivot, a very bullish candle could form tomorrow, possibly stretching towards $8.0. Expect some profit-taking at that level, and depending on the strength and impact of tailwinds, a possible new all-time high to form. If any economic data turns markets risk-off, expect investors to cut their positions in SAND resulting in a quick break of the green ascending trend line, and a nosedive back towards $4.0.
Author

Filip Lagaart
FXStreet
Filip Lagaart is a former sales/trader with over 15 years of financial markets expertise under its belt.


