SafeMoon Price Prediction: SAFEMOON must crack critical resistance to recover
- SafeMoon price seems to have formed a descending parallel channel pattern on the 4-hour chart.
- A spike in buying pressure could lead SAFEMOON to retest the resistance at its last all-time high of $0.000015.
- The resistance barrier in the parallel channel has continued to prevent SAFEMOON from moving further.

After testing the channel's upper resistance on May 6 at $0.000012, SAFEMOON has regressed 50% and is currently trading at $0.0000065. This behavior of Safemoon price has formed a descending parallel channel that keeps the digital asset bouncing between the trends lines in an accumulation phase.
SafeMoon price targets higher highs
SafeMoon price has endured a consolidation period for three weeks that began on May 6. Safemoon price has recorded a series of lower lows and lower highs since then. The upper trendline resistance level at $0.000010 continued to prevent SAFEMOON advance.
Such market behavior formed a descending parallel channel on the 4-hour chart. A recent increase in buying pressure behind the SafeMoon price would allow the break out of the channel's upper trendline.
SafeMoon price should convert the 200 four-hour moving average that acts as resistance into support, which could lead to an upswing towards the channel's upper boundary at $0.000010.
If SAFEMOON manages to break this barrier, the digital asset will start a bullish rally of nearly 60%, reaching $0.000014. This target is determined by measuring the width of the parallel channel and adding it to the breakout point.
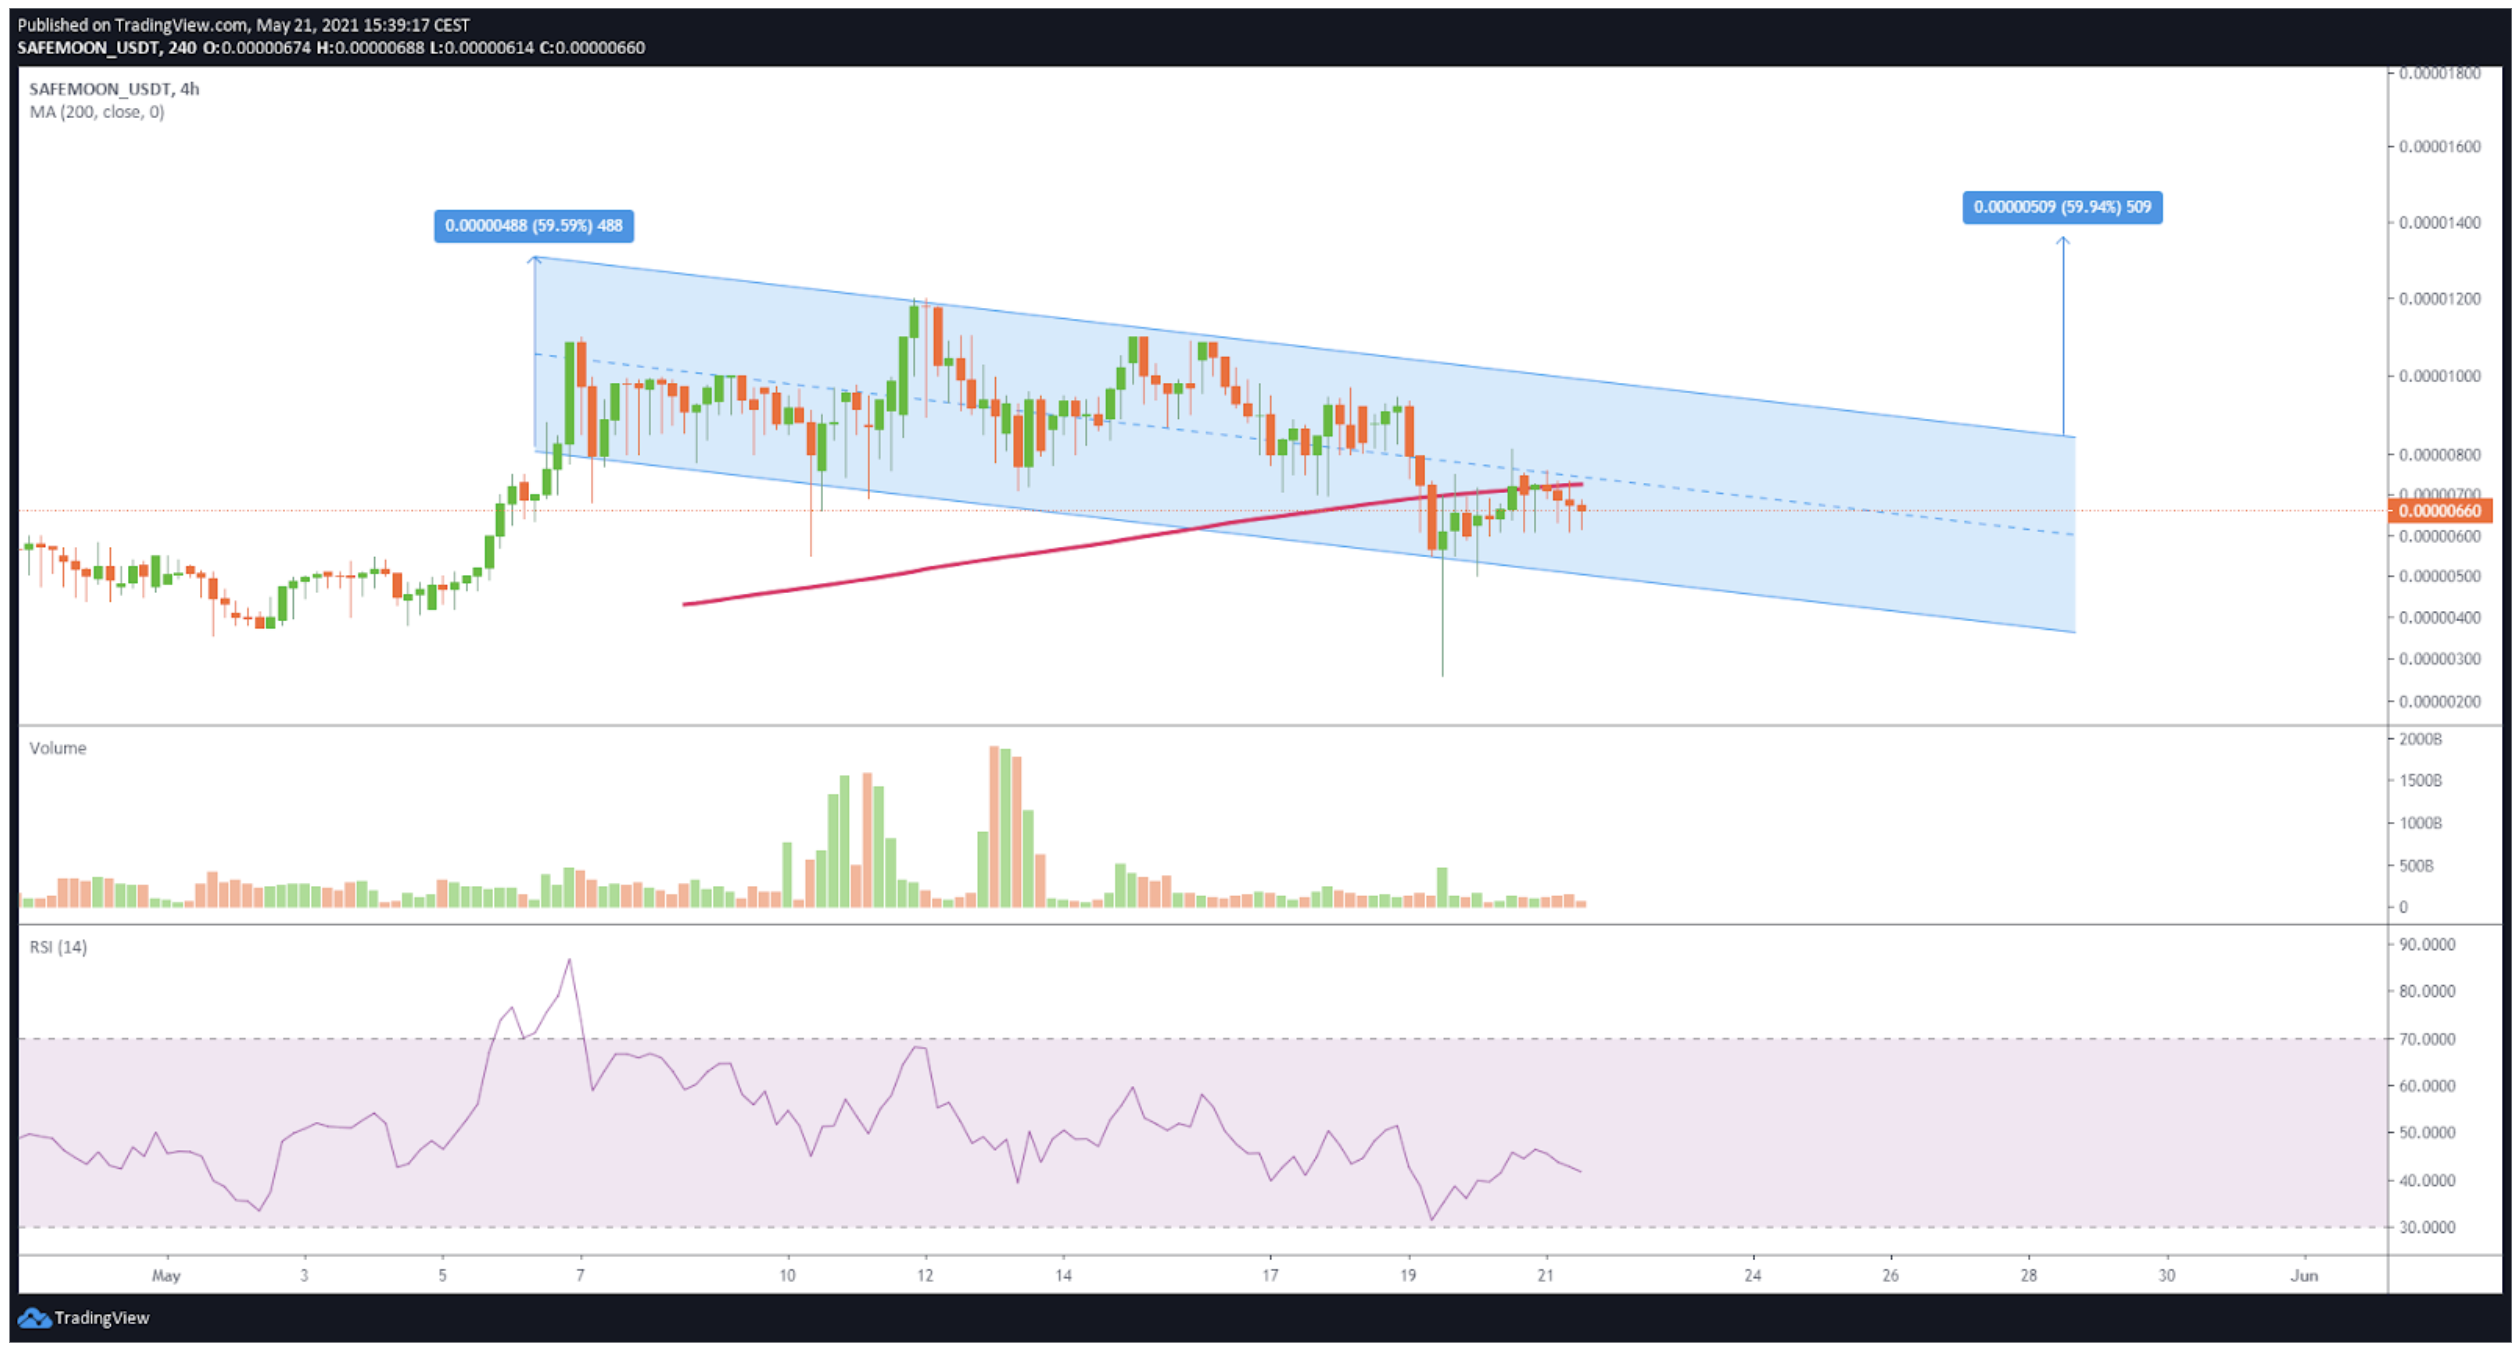
SAFEMOON/USDt 4-hour chart
An increase in profit-taking by investors would lead SAFEMOON to collapse below the channel's lower trend line, which may push SafeMoon price to the recent May 16 low at $0.0000026.
Author
FXStreet Team
FXStreet
Composed of a group of economic journalists and FX experts, the FXStreet content team produces and oversees all content published on FXStreet. It provides a purely journalistic approach to the Forex market.


