- SafeMoon price on the backfoot after a negative weekend.
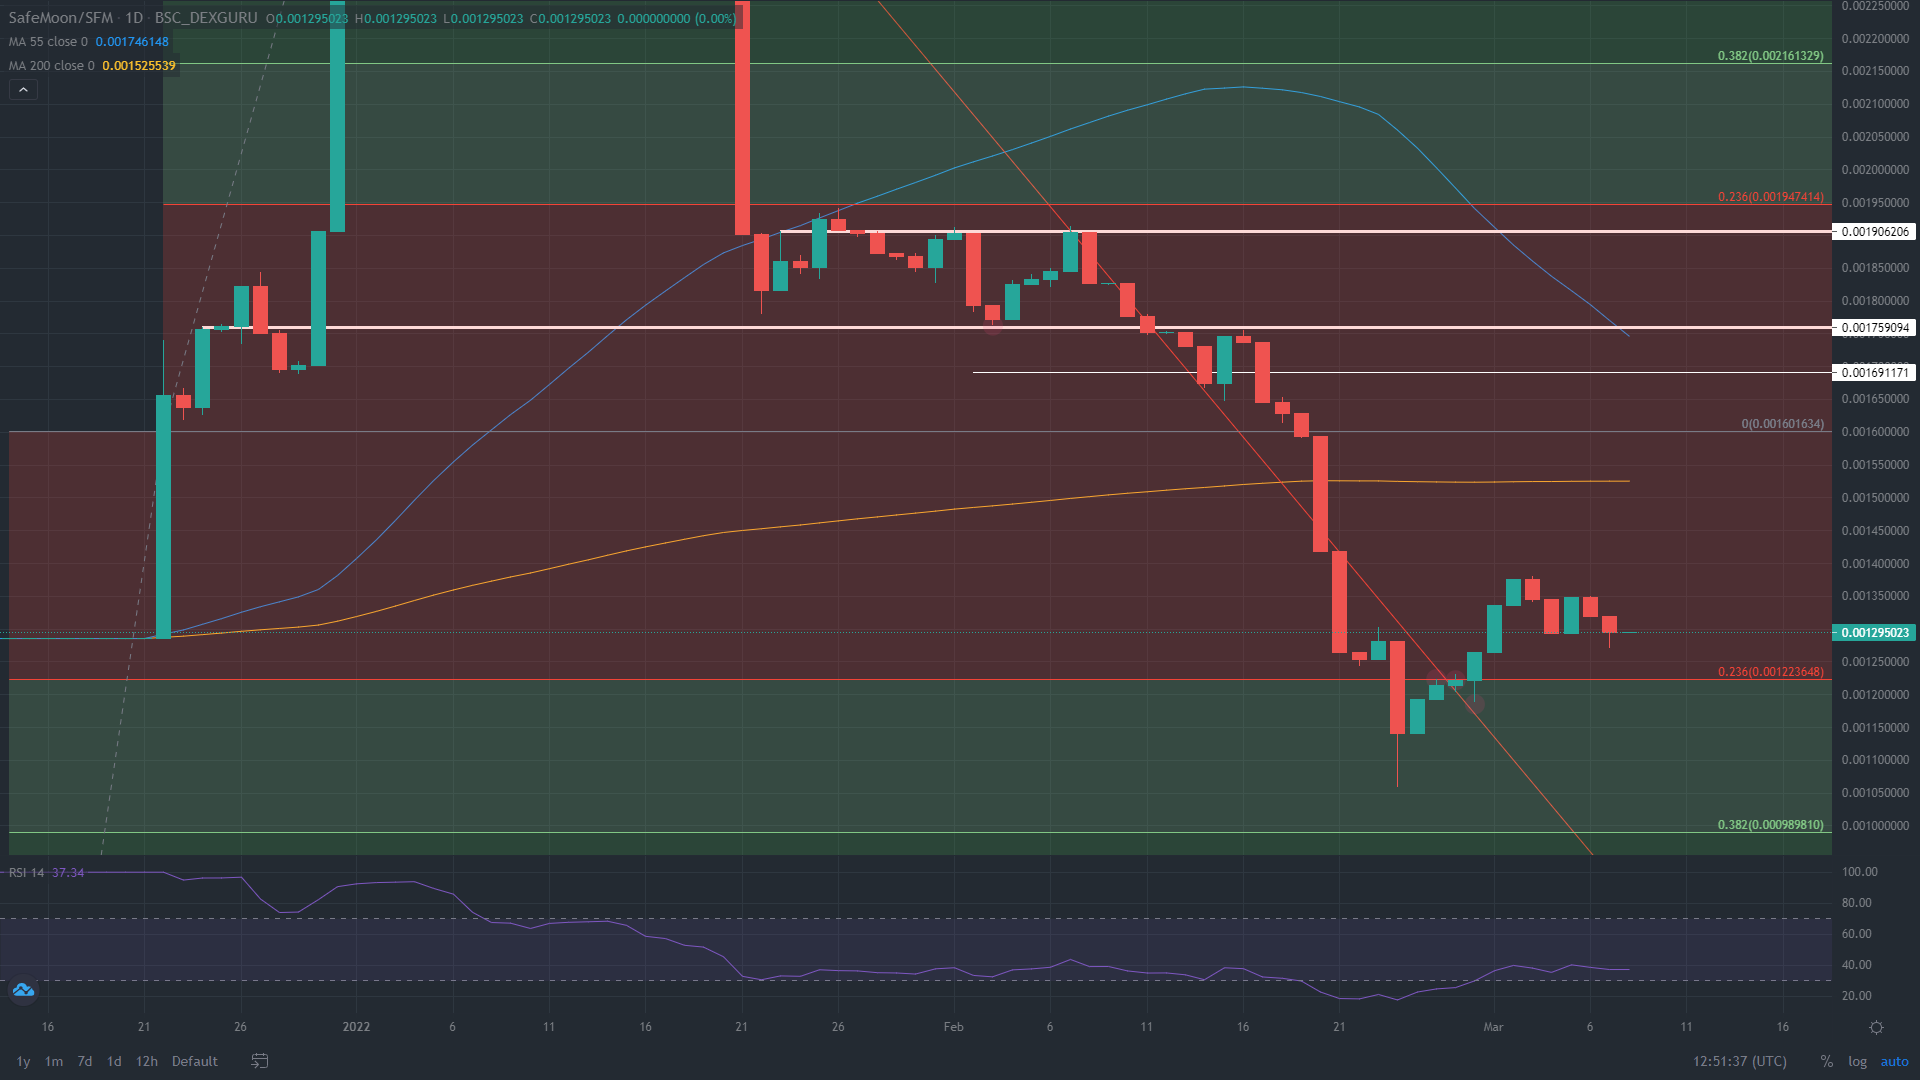
- Price set to drop to the low of last week at $0.00120000.
- Expect to see a possible further downturn, as a test of $0.001000000 is on the cards.
SafeMoon price action is in consolidation mode again after price punched below the low of last week over the weekend and now looks set to square the low of March. As news keeps developing in Russia and Ukraine, it is clear that SafeMoon investors are merely riding the waves created by this event with no real clear sense of direction. Expect more whipsawing price action as the Relative Strength Index (RSI) remains subdued to the downside near oversold.
SafeMoon price poised for a bearish outlook
SafeMoon price action has shredded all the profits accrued from the previous trading week in just one weekend as several sources confirmed that any cease-fires had failed. With new talks underway this afternoon, the message from Russia remains bearish given their demand for full compliance from Ukraine. As this situation remains very binary, it looks like SafeMoon still has more room to dip to the downside.
Expect to see a test of $0.001223648, which is the 23.6% Fibonacci level, and in the process, a new two week low. With the RSI very close to being oversold, although the downside looks limited, the pressure from bears and short-sellers is just so immense to let up as liquidity starts to tighten little by little. Should peace talks fail again this afternoon, and the hostile rhetoric grow bigger again, expect to see a further drop towards $0.000989810, breaking below $0.001000000, and a bounce off the 38.2% Fibonacci level.
SAFEMOON/USD daily chart
Should a breakthrough be brokered between Russia and Ukraine, however, expect to see a sharp rally across the board in all cryptocurrencies. For SafeMoon that would mean a pop above $0.001400000 for a new March high. Another leg higher could target $0.001601634, although the 200-day Simple Moving Average at $0.001525539 could trigger too much profit-taking for the rally to go much further.
Information on these pages contains forward-looking statements that involve risks and uncertainties. Markets and instruments profiled on this page are for informational purposes only and should not in any way come across as a recommendation to buy or sell in these assets. You should do your own thorough research before making any investment decisions. FXStreet does not in any way guarantee that this information is free from mistakes, errors, or material misstatements. It also does not guarantee that this information is of a timely nature. Investing in Open Markets involves a great deal of risk, including the loss of all or a portion of your investment, as well as emotional distress. All risks, losses and costs associated with investing, including total loss of principal, are your responsibility. The views and opinions expressed in this article are those of the authors and do not necessarily reflect the official policy or position of FXStreet nor its advertisers. The author will not be held responsible for information that is found at the end of links posted on this page.
If not otherwise explicitly mentioned in the body of the article, at the time of writing, the author has no position in any stock mentioned in this article and no business relationship with any company mentioned. The author has not received compensation for writing this article, other than from FXStreet.
FXStreet and the author do not provide personalized recommendations. The author makes no representations as to the accuracy, completeness, or suitability of this information. FXStreet and the author will not be liable for any errors, omissions or any losses, injuries or damages arising from this information and its display or use. Errors and omissions excepted.
The author and FXStreet are not registered investment advisors and nothing in this article is intended to be investment advice.
Recommended Content
Editors’ Picks
Ripple's move above this key level could trigger nearly 50% rally for XRP
Ripple has overcome a critical resistance level and flipped into a support floor on the weekly time frame. This development happened while XRP tightly consolidated for roughly 250 days. Investors can expect XRP to kickstart a massive rally.
Optimism price outlook with nearly $90 million worth of OP tokens flooding markets on Friday
Optimism volatility has shrunk in the ours leading to the network’s cliff unlock. It joins the likes of dYdX and Sui, which have similar events on their calendars. As token unlocks are often considered bearish catalysts, investors should brace for a reaction after the event.
Top 3 Price Prediction Bitcoin, Ethereum, Ripple: Retail watches from the sidelines with a bias for shorts
Bitcoin could clear $73,777 peak as BTC bulls resurface. Ethereum might fall 10% before next leg up as ETH RSI teases with sell signal. XRP could lose $0.6000 threshold as Ripple bulls fail to show up.
Jito price could hit $6 as JTO coils up inside this bullish pattern
Jito price action shows a potential cup and handle formation. Based on theoretical measurement rules, a successful breakout could yield a 56% rally to $6.0. A breakdown of the $3.86 support level would create a lower low for JTO and invalidate the bullish thesis.
Bitcoin: BTC may have recovered, but is it out of the woods?
Bitcoin’s (BTC) upward momentum has shown a significant decline for the past two weeks or so. This development led to a bearish signal on the weekly and an uncertain outlook on the monthly.