SafeMoon bearish continuation pattern hints at a nosedive to $0.00007
- SafeMoon price is inside a bear flag pattern, warning that a continuation move south is very likely.
- Ichimoku price action structure is indecisive but leans more to the bear side than the bull.
- It is easier for SafeMoon to move up from its present position, but resistance may be too strong.

SafeMoon price is stuck inside the Ichimoku Cloud – the place where trading accounts go to die. The Cloud and the bear flag give both sides of the market opportunities. Directional bias is weighted more to the downside than the upside.
SafeMoon price presents a long and short opportunity on the 4-hour Ichimoku Kinko Hyo Chart
SafeMoon price has a long opportunity present upon a successful 4-hour close above the Tenkan-Sen and Kijun-Sen. The hypothetical long entry is a buy stop order at $0.00124, a stop loss at $0.00116, and a profit target at $0.00145. The trade setup represents a 3:1 reward for the risk setup.
Caution should be given on the long side of the market. If the long entry does trigger, then the top of the bear flag is not far away and may act as a strong resistance level.
On the short side of the market – and the most probable to play out – there is a theoretical short trade with a sell stop order at $0.00105, a stop loss at $0.00112, and a profit target at $0.000071. The short idea represents 3.3:1 rewards for the risk.
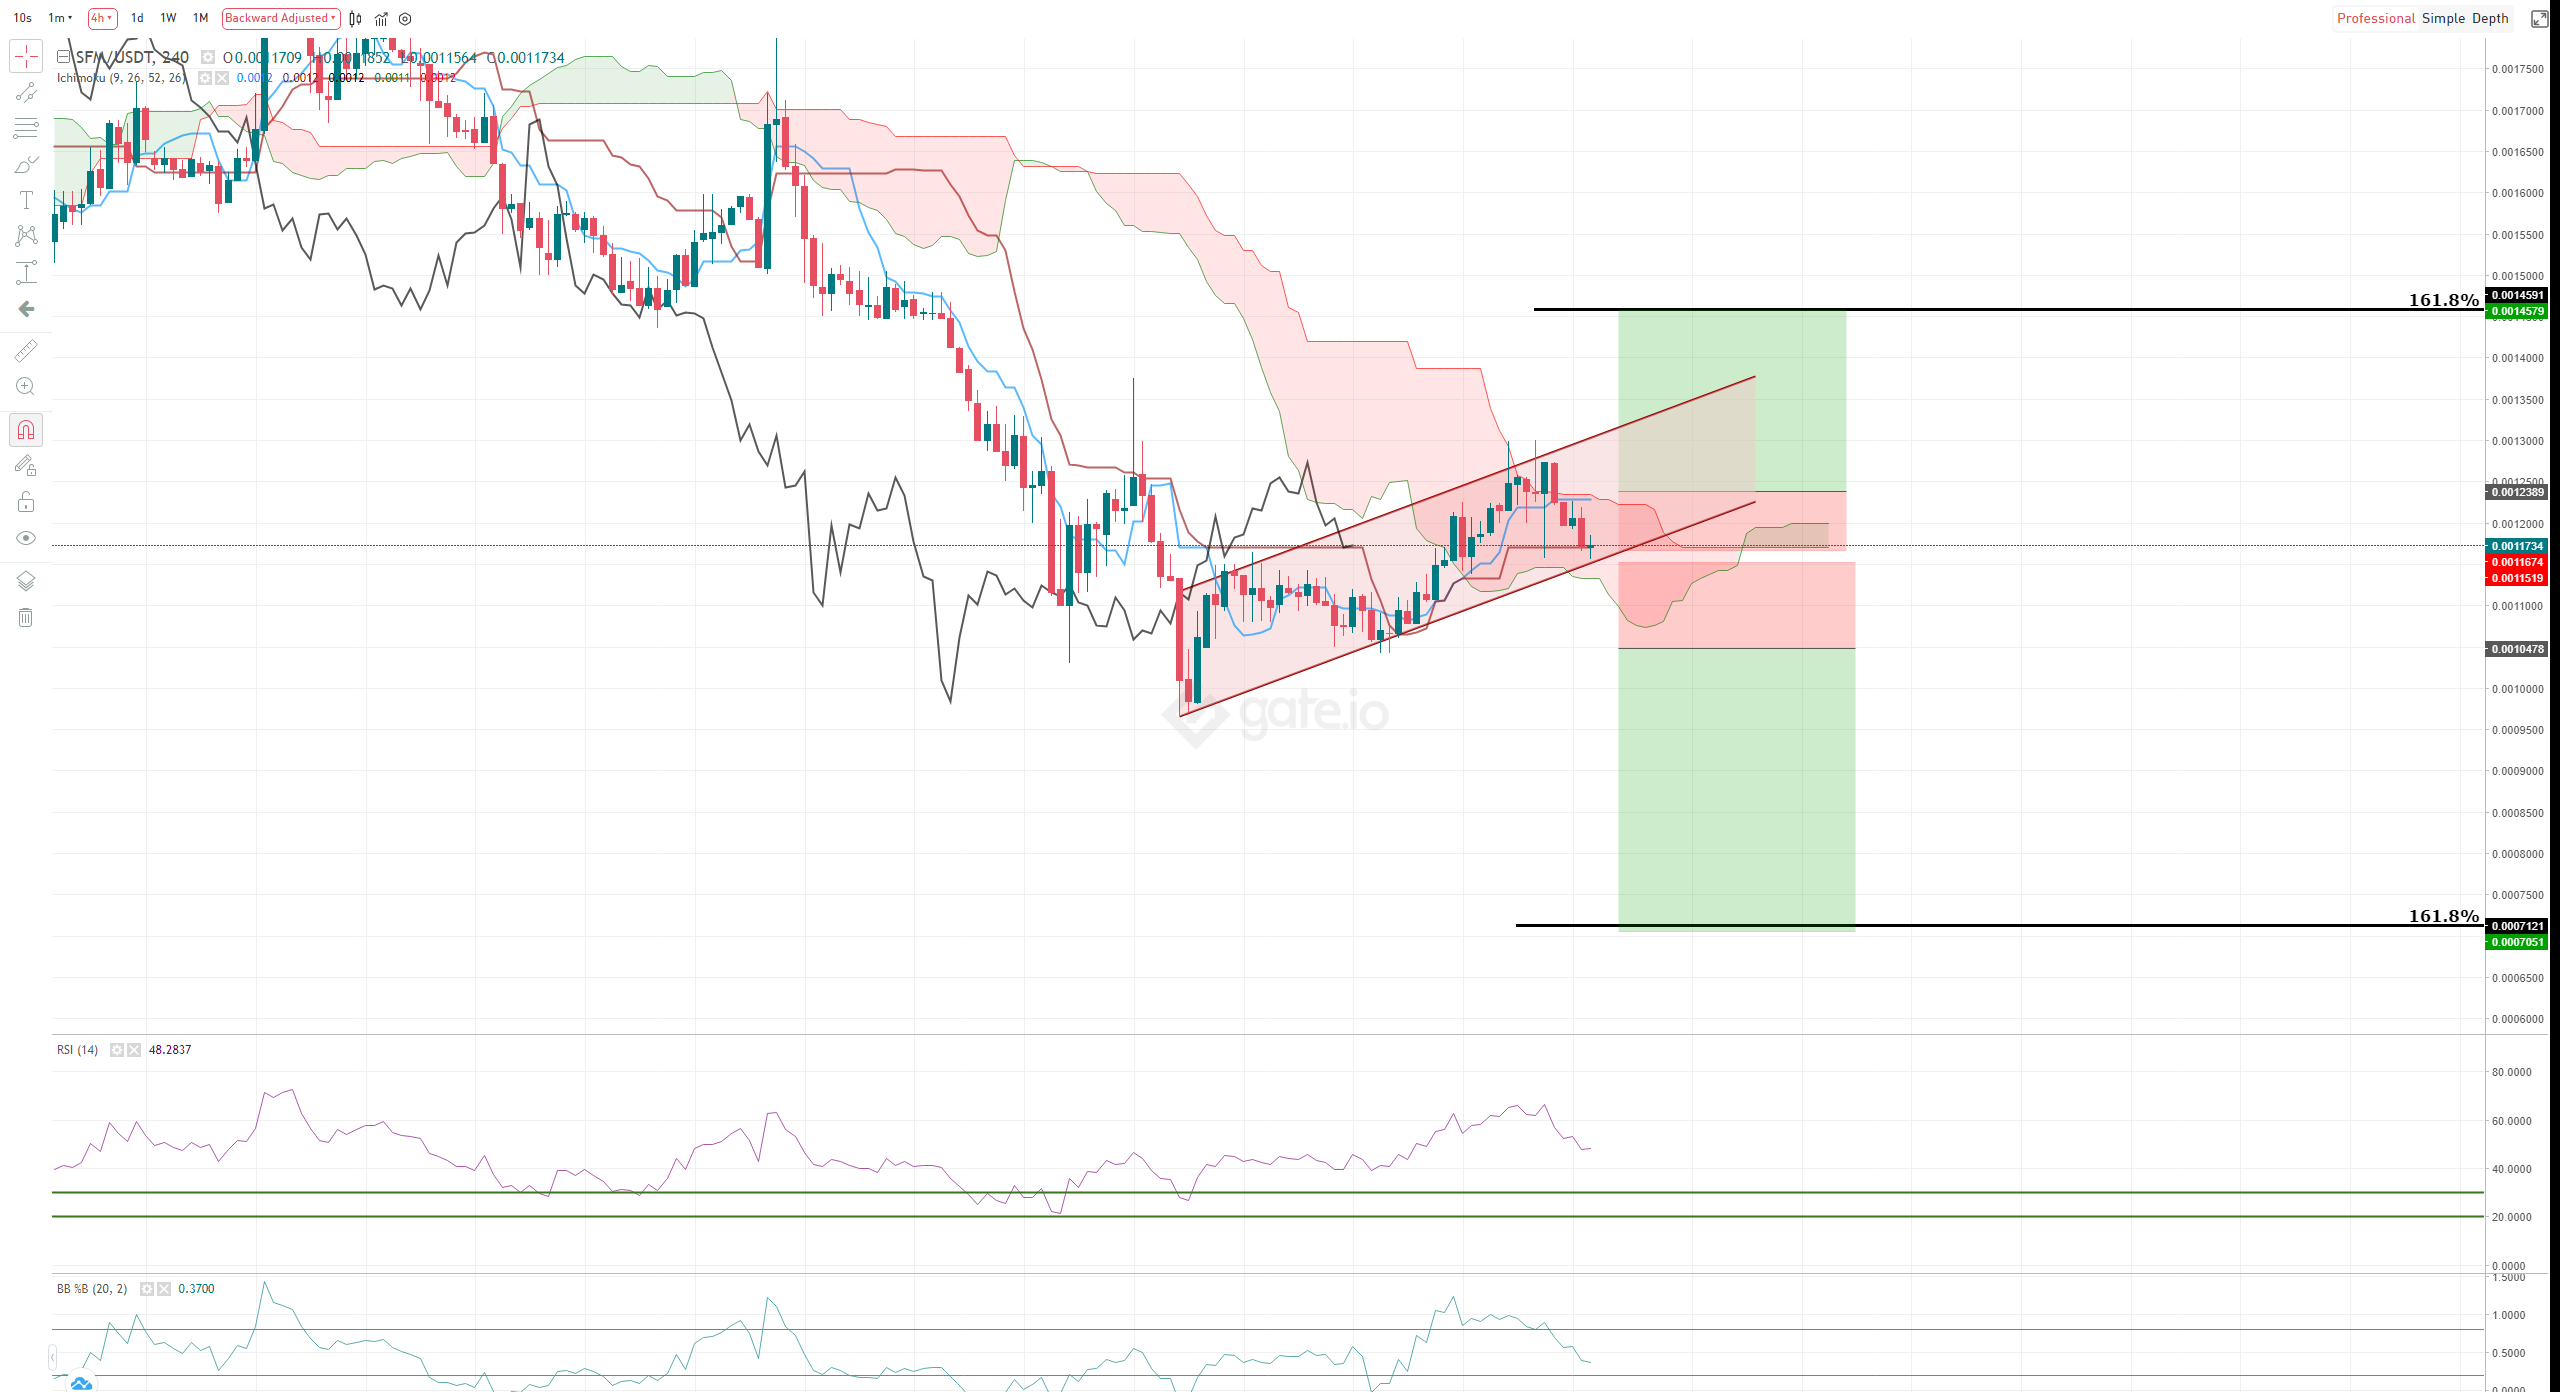
SFM/USDT 4-hour Ichimoku Kinko Hyo Chart
The short entry benefits from confirming two bearish events; the first is the breakout below the bear flag. The second, and most important, is the confirmation of an Ideal Bearish Ichimoku Breakout. The last time SafeMoon price completed an Ideal Bearish Ichimoku Breakout was on February 18, 2022 – the move that preceded a 35% wipe in SafeMoon price value.
Author

Jonathan Morgan
Independent Analyst
Jonathan has been working as an Independent future, forex, and cryptocurrency trader and analyst for 8 years. He also has been writing for the past 5 years.


