Safemoon price has 45% upside potential if bulls can break $0.000004
- Safemoon price saw 111% of gains in just one week.
- With the renewed media attention, more buyers are attracted, and buy-side volume is picking up.
- When bulls can break $0.000004, expect the uptrend to hit $0.00000489$.

Safemoon (SAFEMOON) price has been in an uptrend throughout October and attracted much media attention after gaining just 111% of market value in a couple of days. With that renewed attention, more buyers, both retail and institutional, are buying Safemoon.
Safemoon price sees buy-side volume explode
Safemoon price has been on a good uptrend throughout October. But the uptrend accelerated after bulls broke and consolidated price above the 78.6% Fibonacci level at $0.00000296. The renewed media attention for Safemoon has created a favorable tailwind that now sees momentum building for a breakout in favor of the bulls. As the buy-side volume exploded in the past couple of days, expect the cap at $0.00000400 to break and a test of $0.00000489.
Safemoon price looks to be well-respecting the Fibonacci retracement from the all-time low towards the high from May. The white rectangles on the chart highlight interesting technical levels that fall in line with the different Fibonacci levels. This builds the case that with the current Safemoon price, the uptrend has still 45% of additional profits to go before hitting the next Fibonacci level to the upside.
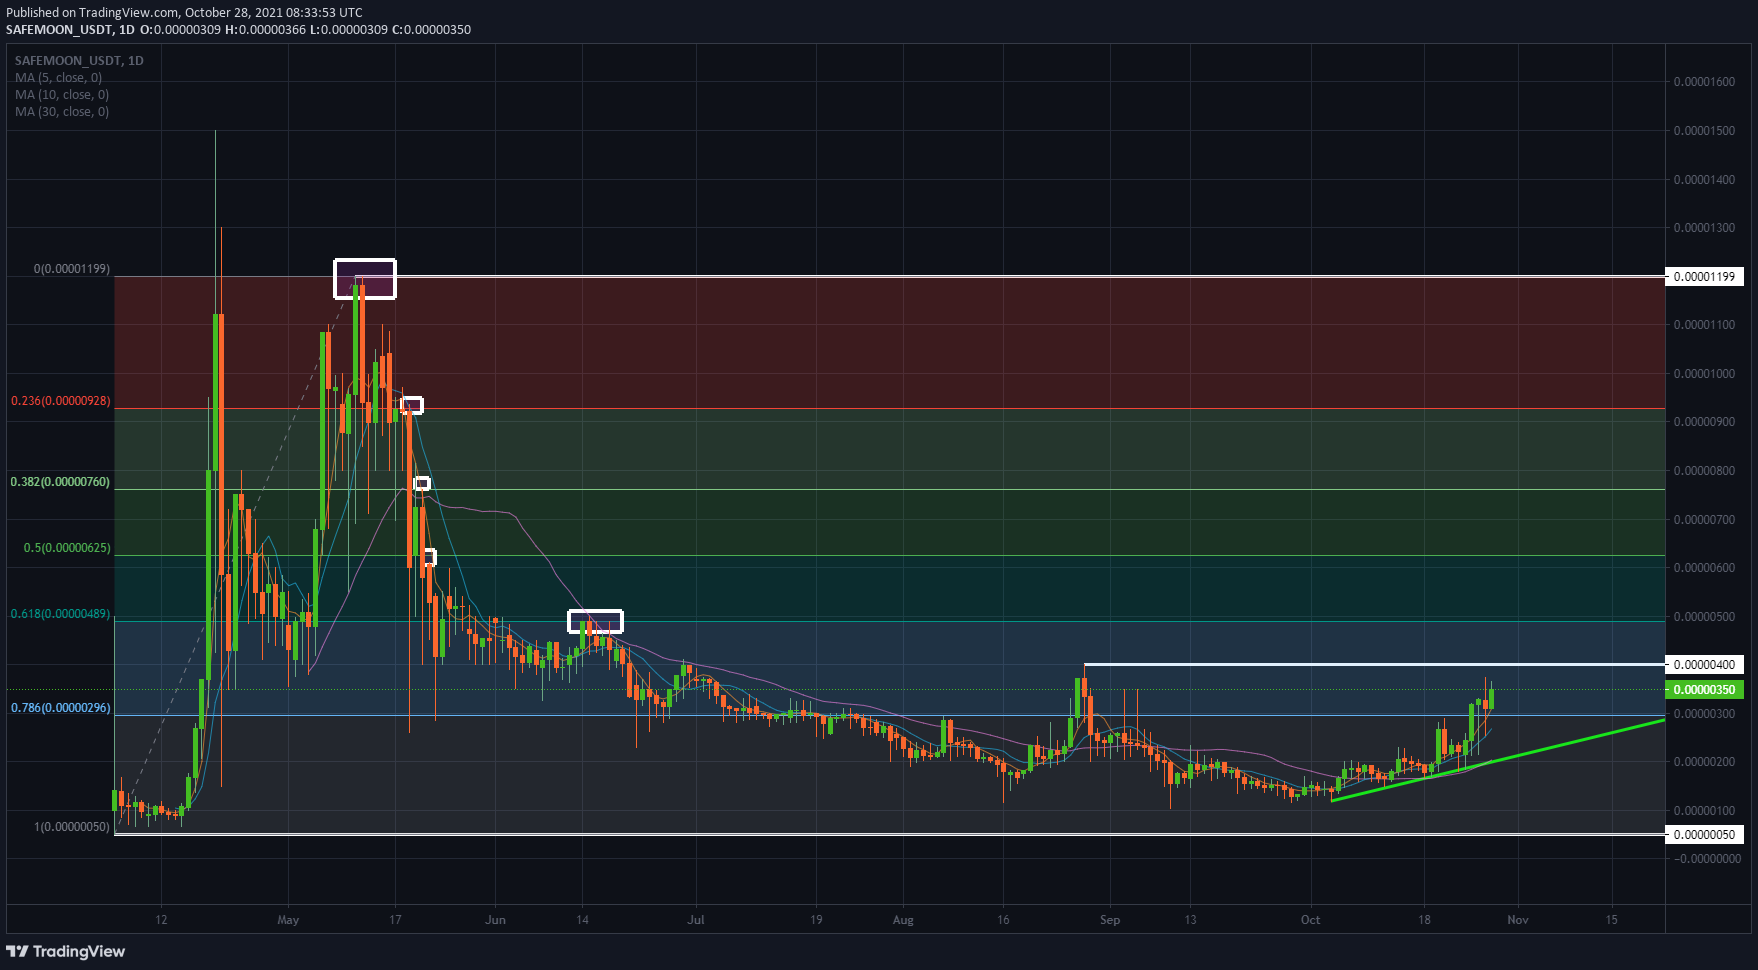
SAFEMOON/USD daily chart
As the current volume comes in on the back of significant media attention, expect this volume to potentially decline should the favorable tailwinds start to fade. Expect Safemoon price to quickly retest circa $0.00000296 and the green ascending trend line, which is the backbone of the current uptrend. A break below that ascending trend line would see Safemoon price quickly nose dive to $0.00000050.
Author

Filip Lagaart
FXStreet
Filip Lagaart is a former sales/trader with over 15 years of financial markets expertise under its belt.


