SafeMoon Price Forecast: SAFEMOON to shed 36% to retest critical support barrier
- SafeMoon price appears to be losing steam after failing to breach the resistance level at $0.00000560.
- A decisive close below $0.00000417 will confirm a new downtrend’s start, pushing SAFEMOON 32% lower.
- If the bulls breach past $0.00000560, a bullish scenario will develop.

SafeMoon price lacks the momentum to rally higher, which has kept it below a crucial resistance level. A continuation of the current downtrend will drag SAFEMOON to a key demand level.
SafeMoon price primes for lower low
On the 4-hour chart, SafeMoon price has sliced through the 50 four-hour Simple Moving Average (SMA) at $0.00000470. A successful 4-hour close below this point suggests an increased selling pressure. However, a decisive close below the demand zone’s lower trend line at $0.00000417 will confirm the start of a new downtrend.
In that case, SafeMoon price might drop 15% to $0.00000357. A breakdown of this level could send SAFEMOON spiraling to $0.00000281.
Such a move represents a 36% downtrend from the current price at $0.00000432. Therefore, investors need to keep a close eye on $0.00000417.
In a worst-case scenario, SafeMoon price might drop to $0.00000202, a 53% sell-off from the current position.
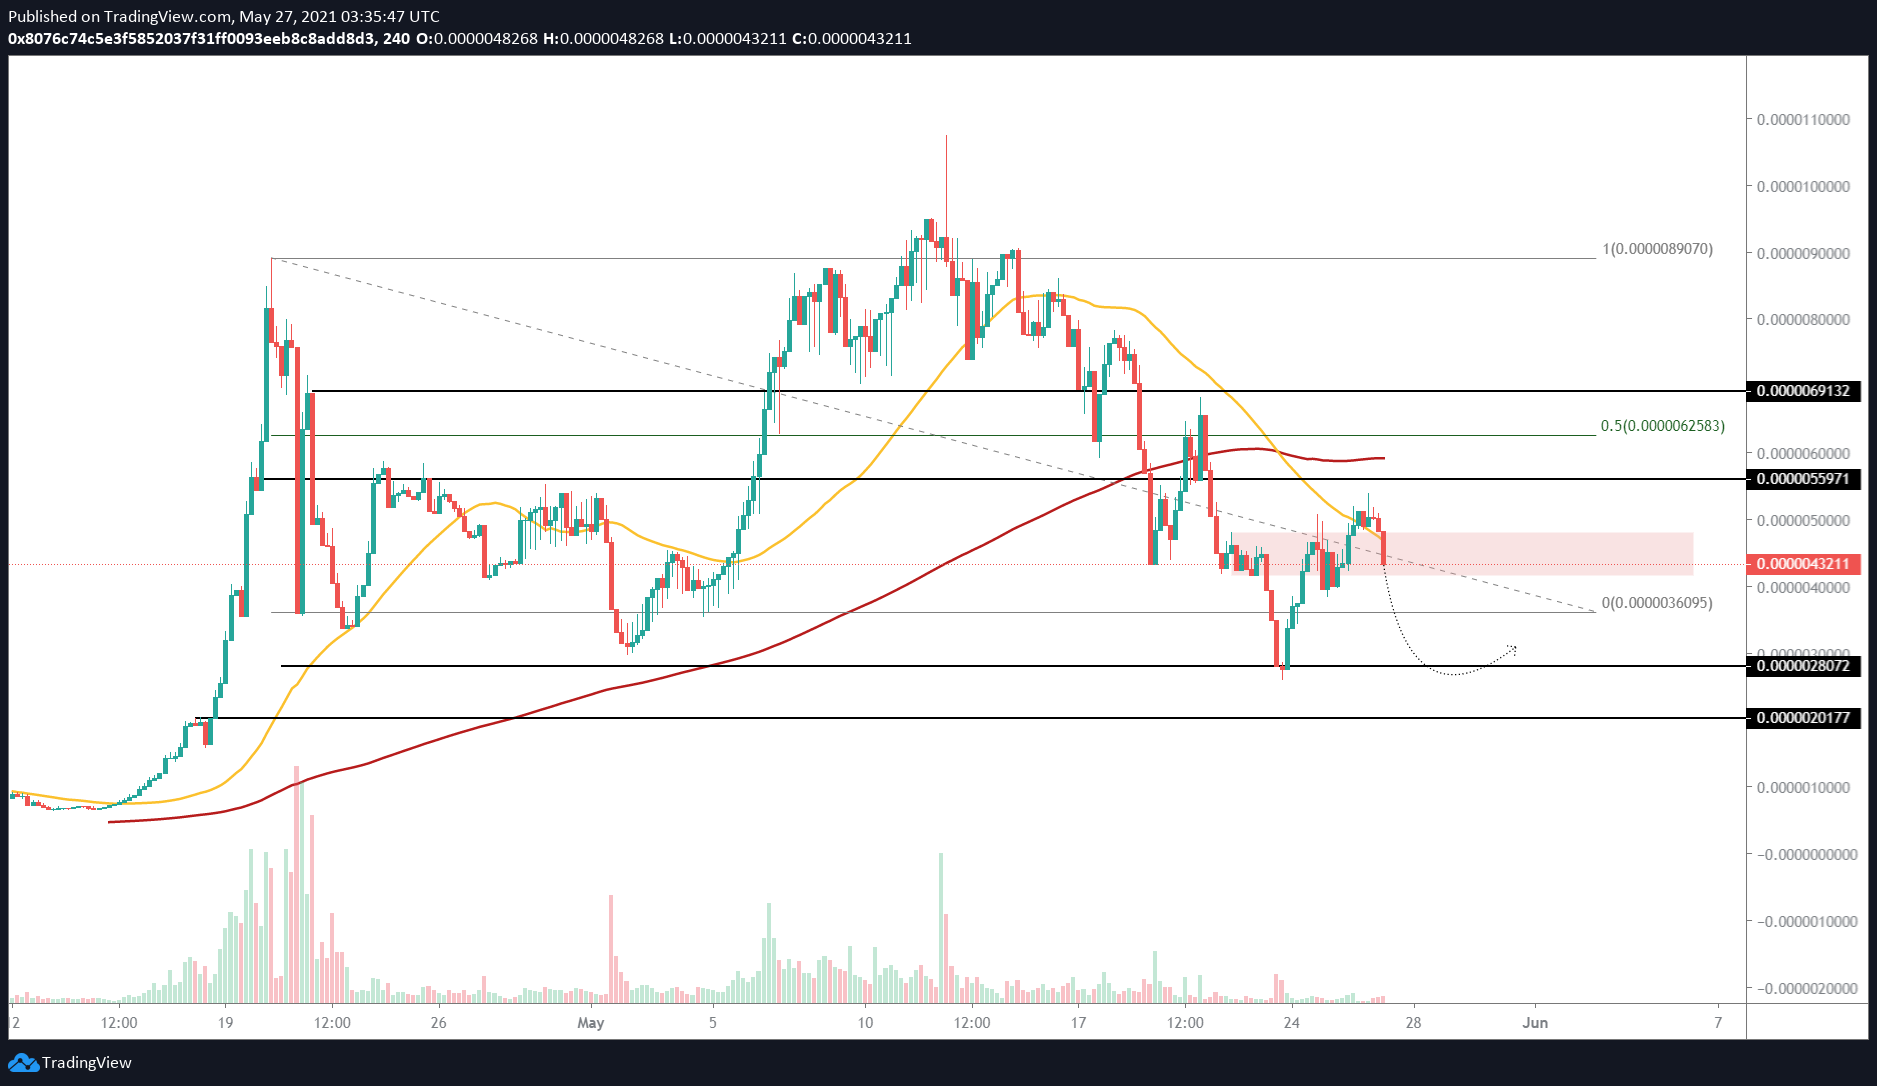
SAFEMOON/USDT 4-hour chart
On the other hand, if SafeMoon price manages to rise past the resistance level at $0.00000560, it will signal a resurgence of buyers. However, a decisive close above the 200 four-hour SMA at $0.00000594 will confirm the start of a new upswing and invalidate the bearish scenario.
Under these conditions, market participants could see SafeMoon price rise 6% to test the 50% Fibonacci retracement level at $0.00000623.
If the buying pressure continues to persist beyond this point, SAFEMOON might tag $0.00000691.
Author

Akash Girimath
FXStreet
Akash Girimath is a Mechanical Engineer interested in the chaos of the financial markets. Trying to make sense of this convoluted yet fascinating space, he switched his engineering job to become a crypto reporter and analyst.


