SafeMoon price bucks the trend with double-digit gains
- SafeMoon price action is an outlier for the day, outperforming most of the market with a substantial intraday gain.
- Downside price action remains the most likely direction until a clear uptrend is established.
- Whipsaws in price action are likely to continue.

SafeMoon price action has been a textbook example of volatility and whipsaws. During the Thursday trade session, SafeMoon was up nearly 130%. However, almost all of those gains were promptly sold. Despite the selling, SafeMoon is still 30% higher for the day.
SafeMoon price action develops trading opportunities for both sides of the market
SafeMoon price has developed some of the strongest volatility in months. The result of these wild price swings is an opportunity to capitalize on the long or short side of the market.
There is a theoretical short trade setup for SafeMoon price with a sell stop order at $0.00040, a stop loss at $0.00045, and a profit target at $0.000050. This setup represents a 3:1 reward for the risk, with a much tighter stop due to its proximity to prior all-time lows. For that reason, a two-box trailing stop would be beneficial to protect against any likely whipsaws.
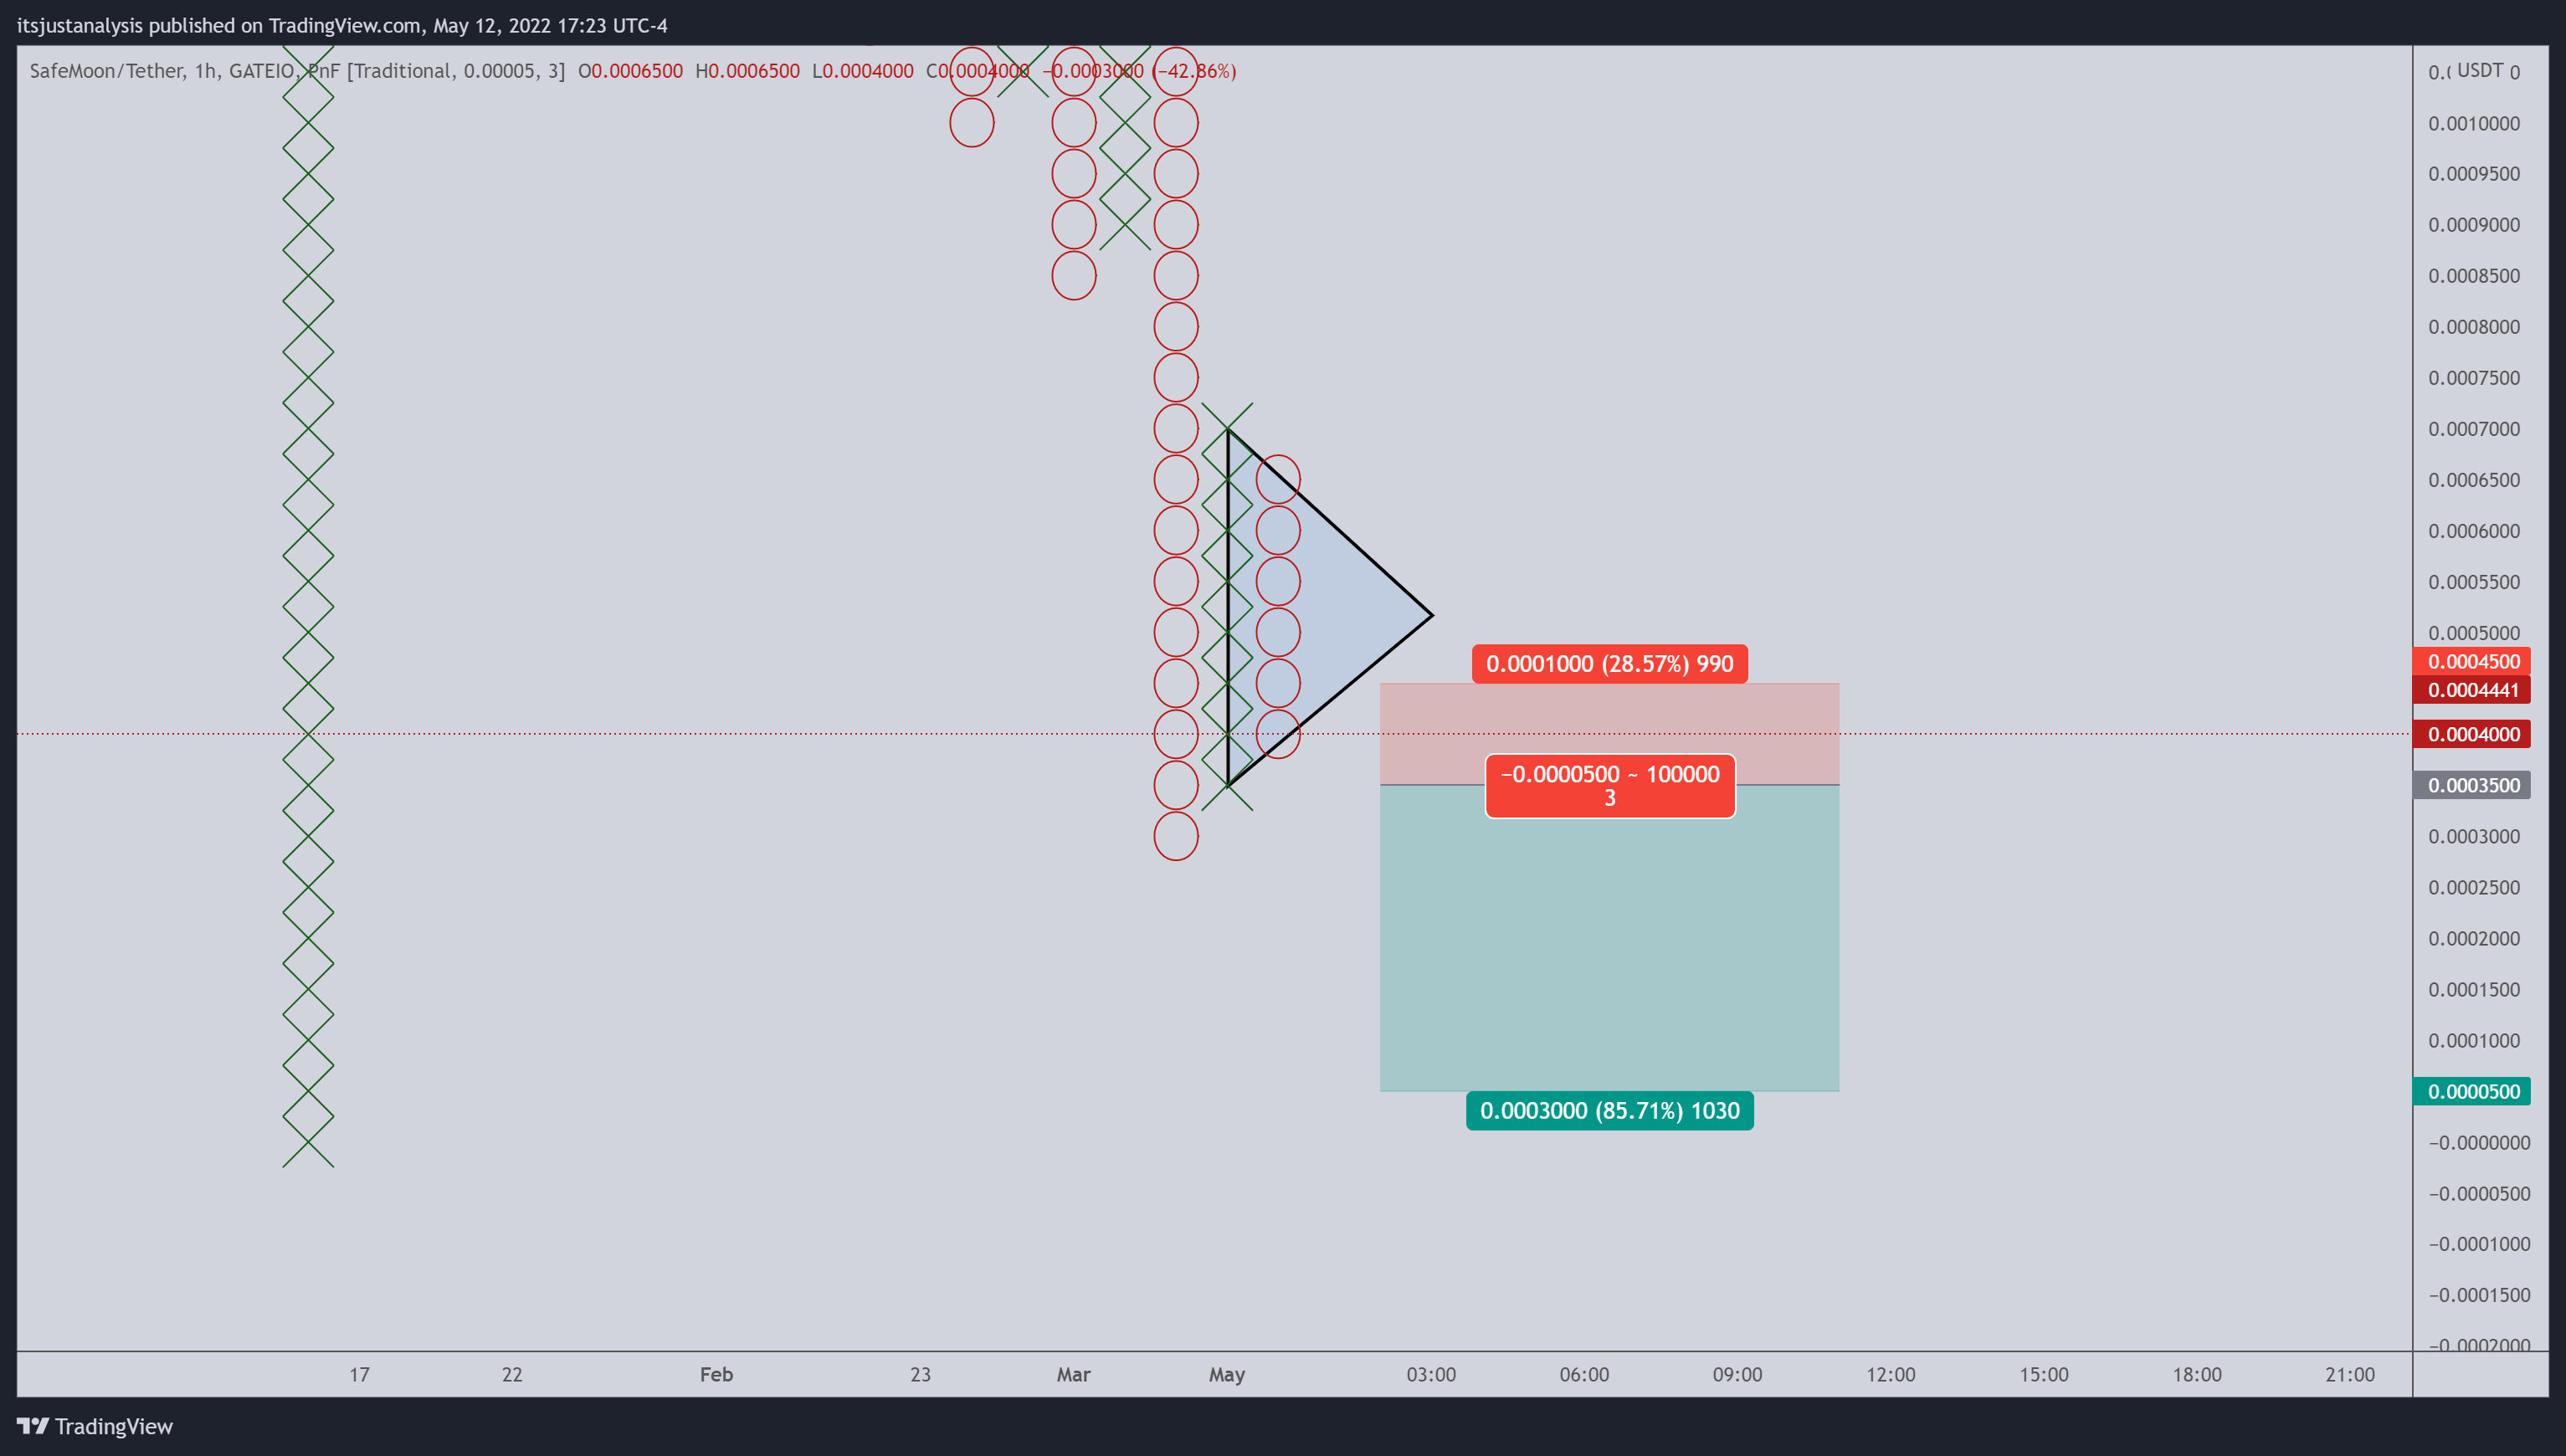
SafeMoon/USDT $0.00005/3-box Reversal Point and Figure Chart
The caveat with the theoretical short trade is the entry must be from at least a triple-bottom. That means SafeMoon price would need to print a reversal column of X’s and then another column of O’s twice to trigger this short entry. It is invalidated if the long entry below triggers first.
On the long side of the SafeMoon price trade, there is a hypothetical setup with a buy stop order at $0.00075, a stop loss at $0.00060, and a profit target at $0.00050. This trade setup represents a 3.33:1 reward for the risk. In addition, a two-box trailing stop would help protect against any profit made post entry.
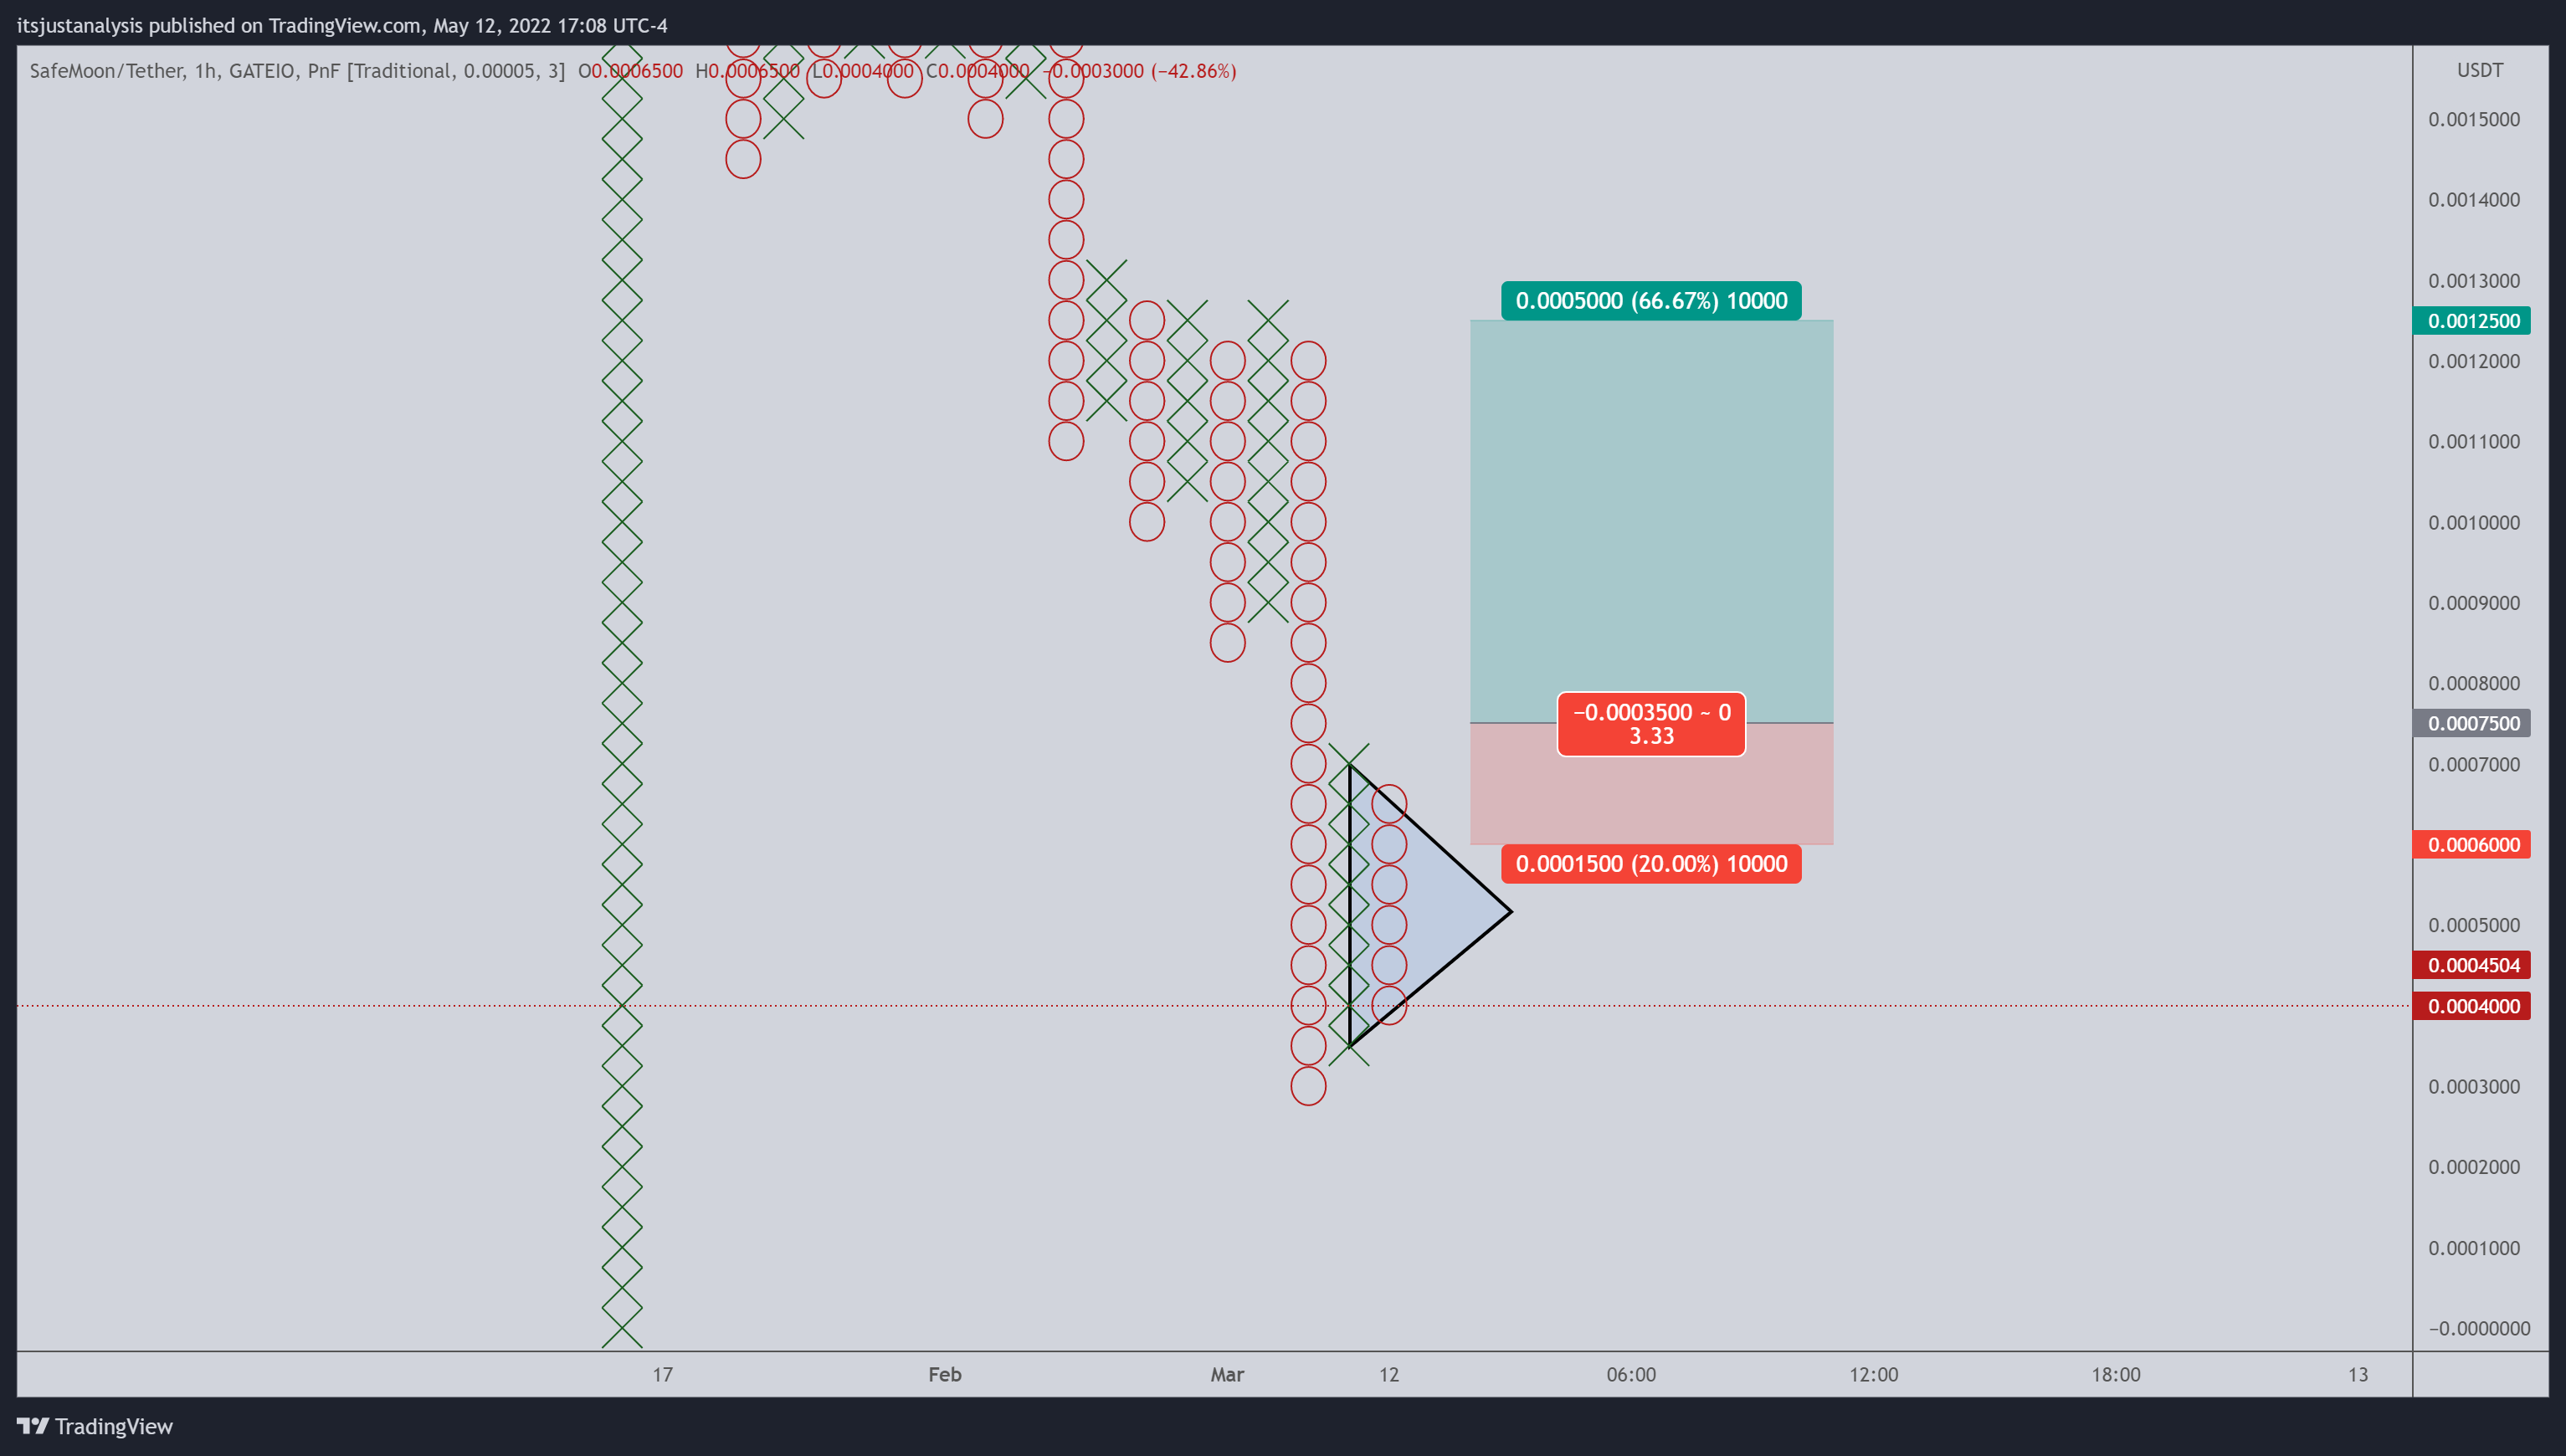
SafeMoon/USDT $0.00005/3-box Reversal Point and Figure Chart
The entry is based on the breakout above the symmetrical triangle and above a double-top. The hypothetical long trade is invalidated if the short entry triggers first.
Author

Jonathan Morgan
Independent Analyst
Jonathan has been working as an Independent future, forex, and cryptocurrency trader and analyst for 8 years. He also has been writing for the past 5 years.


