SafeMoon downside looks more promising as support weakens
- SafeMoon has booked 61% profit on August 27.
- Price has faded since then and is looking to return to the base at $0.00000190.
- The favorable tailwind in cryptocurrencies does not seem to filter through in the price action.

SafeMoon (SAFEMOON) has been in a sweet spot since August 20. The downward pressure on SafeMoon was constantly present since May. Buyers finally could find enough momentum and volume to run up prices again. Buyers already tried on August 7 but got quickly pushed out of their position the day after as price action was paired in full.
SafeMoon might spell another 50% loss
For buyers, the trend higher in SafeMoon might look tempting. The green ascending trend line is in their favor and has already proven its strength in the past on September 3. A few items might run interference for that idea. The upside price action looks well-defined in SafeMoon with the double top formation at $0.00000350. Next to that, and more near-term, the 55-day Simple Moving Average (SMA) might cause some capped upside potential. The bodies of the candles in SafeMoon have found it very difficult to break above it.
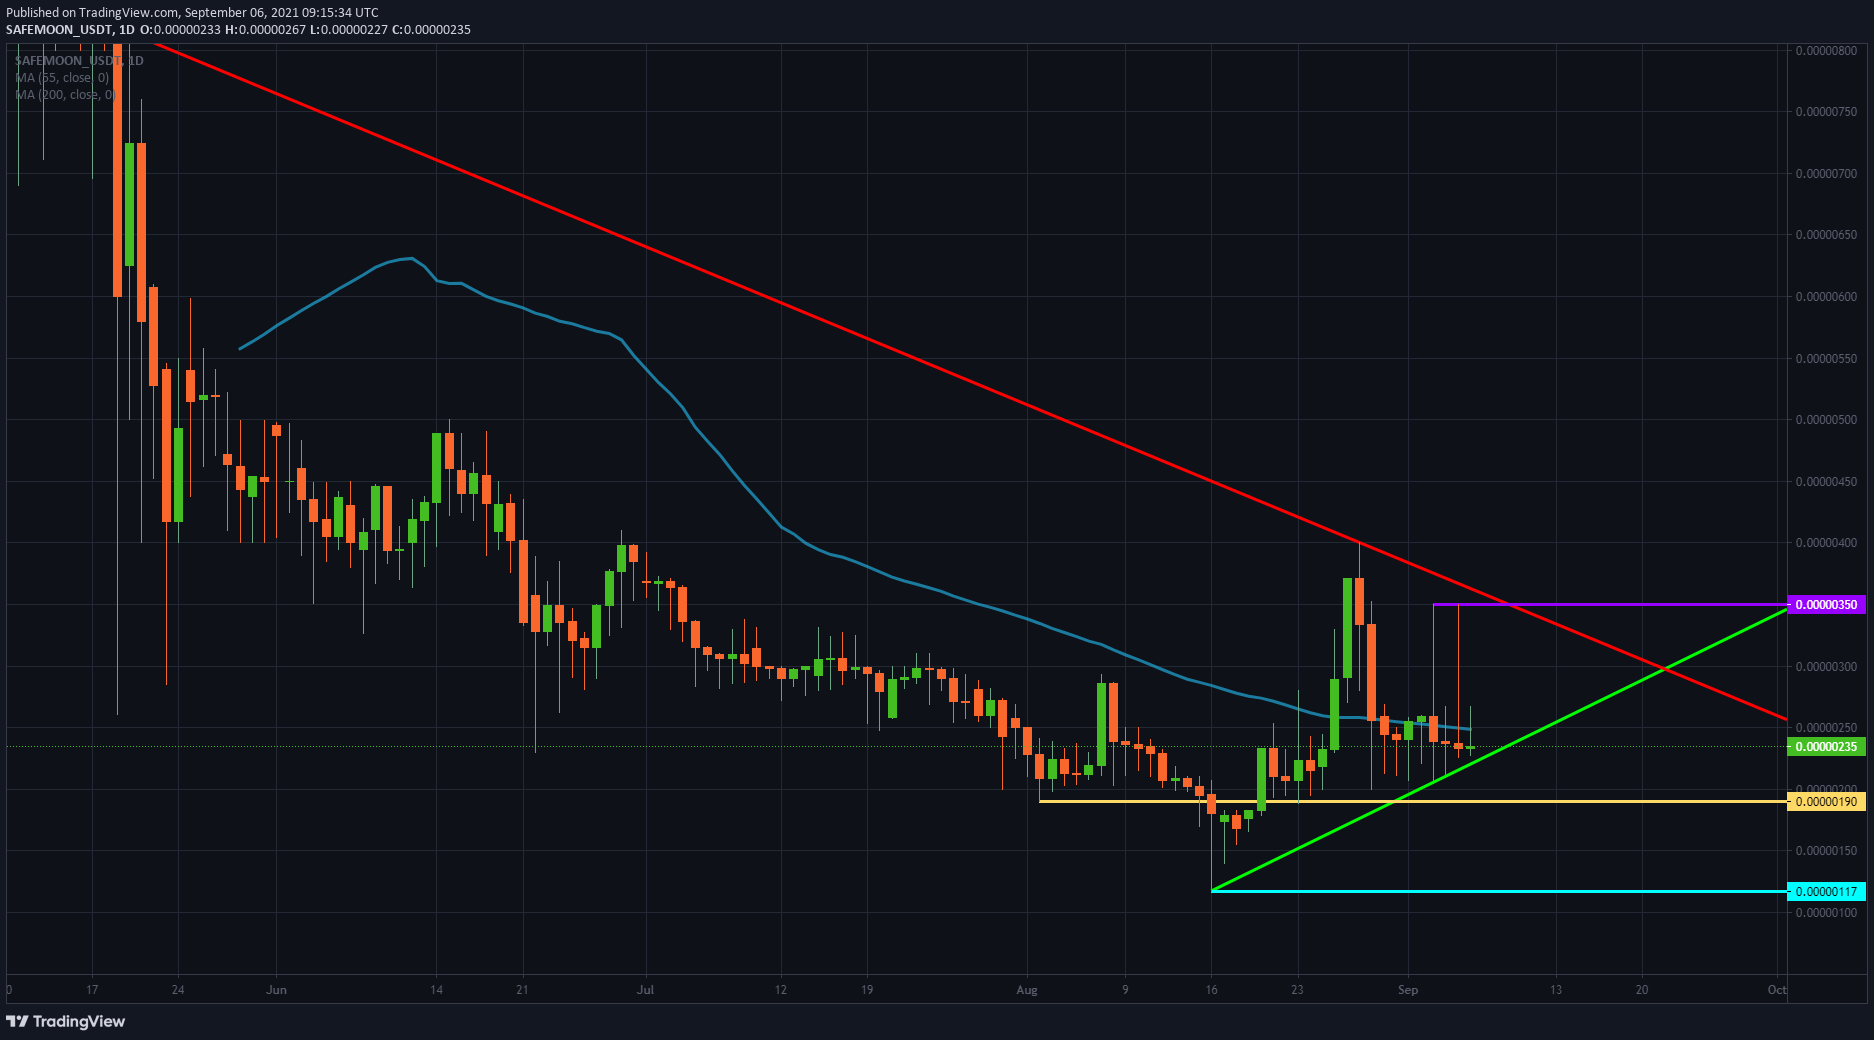
SAFEMOON/USD daily chart
On the downside, a supportive level coming from August 2 should support SafeMoon for now. The level only got broken to the upside or the downside and was tested a couple of times around August 23. Expect first a break of the green ascending trend line. Either sellers completely take over price action and drive SafeMoon through the yellow level at $0.0000190 or SafeMoon will bounce off that level first. Back up, it will hit the green ascending trend line with a failed break higher. That should be the queue for sellers to get in massively. SafeMoon will break $0.00000190 then with solid conviction and look for a retest of the low again from August 16 near $0.00000117.
Author

Filip Lagaart
FXStreet
Filip Lagaart is a former sales/trader with over 15 years of financial markets expertise under its belt.


