Ripple's XRP Technical Analysis: XRP/USD is in further trouble under $0.30
- Ripple's XRP price on Friday is trading back in negative territory, down around 1.5%.
- XRP/USD bears smashed through $0.3000 in the back-end of Thursday's session.

XRP/USD 15-minute chart
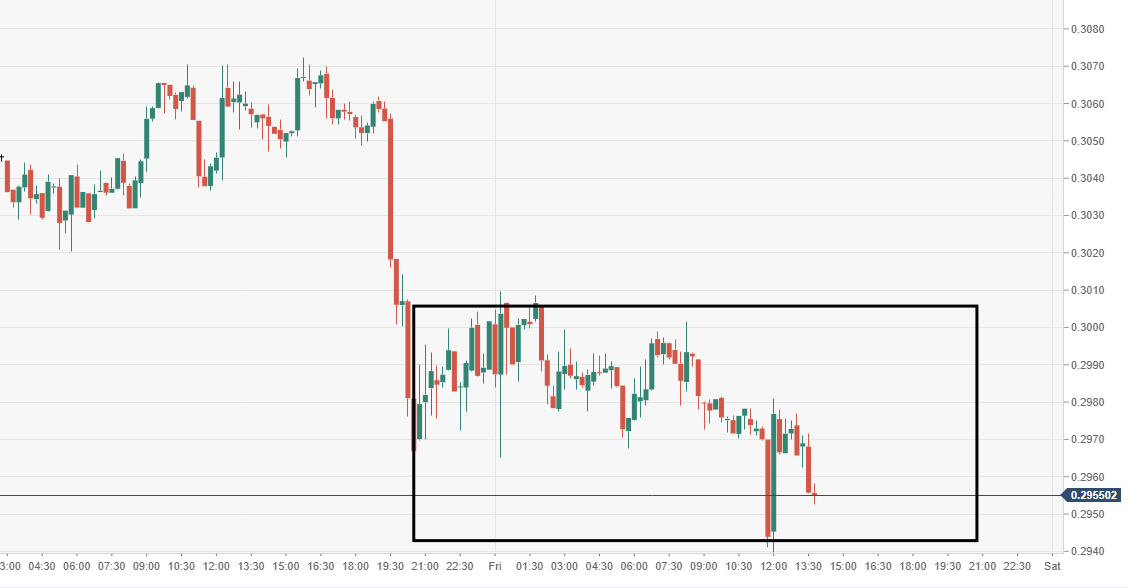
Spot rate: 0.2996
Relative change: -1.47%
High: 0.3009
Low: 0.2939
Trend: Bearish
Support 1: 0.2943, daily pivot point support.
Support 2: 0.2885, daily pivot point support.
Support 3: 0.2812, daily pivot point support.
Resistance 1: 0.3074, daily pivot point resistance.
Resistance 2: 0.3146, daily pivot point resistance.
Resistance 3: 0.3204, daily pivot point resistance.
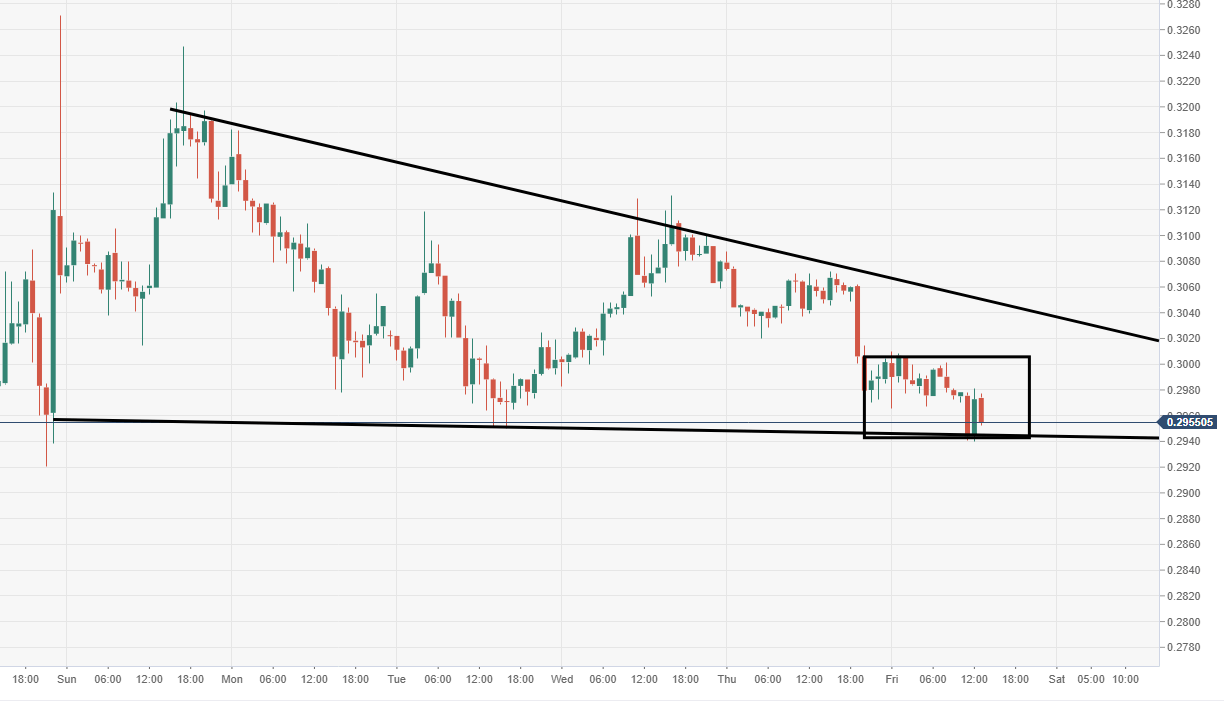
XRP/USD 60-minute chart
- Price action moving within a horizontal wedge pattern as seen via the 60-minute chart view, subject to a breakout south.
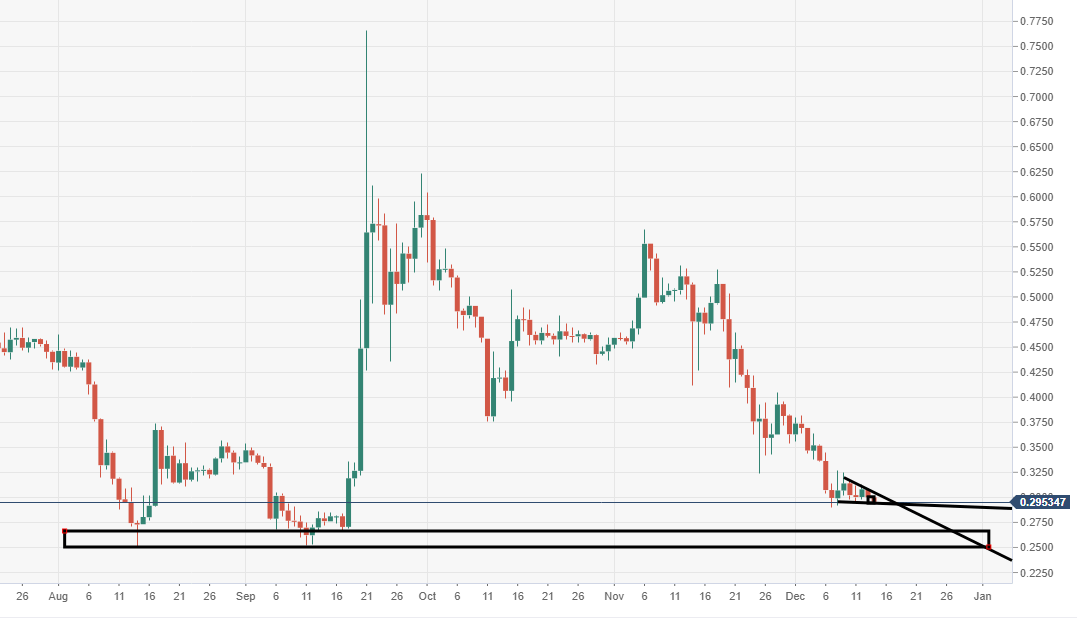
XRP/USD
- Vulnerabilities point to the downside, as price looks to be shaping up within a bearish pennant, as mentioned above via 60-minute view within the wedge.
Author

Ken Chigbo
Independent Analyst
Ken has over 8 years exposure to the financial markets. He started his career as an analyst, covering a variety of asset classes; forex, fixed income, commodities and equities.


