Ripple's XRP Technical Analysis: XRP/USD breaks above descending trend line resistance
- XRP price on Thursday trading marginally in the green, by just 0.45%, as bulls continues to search for gains.
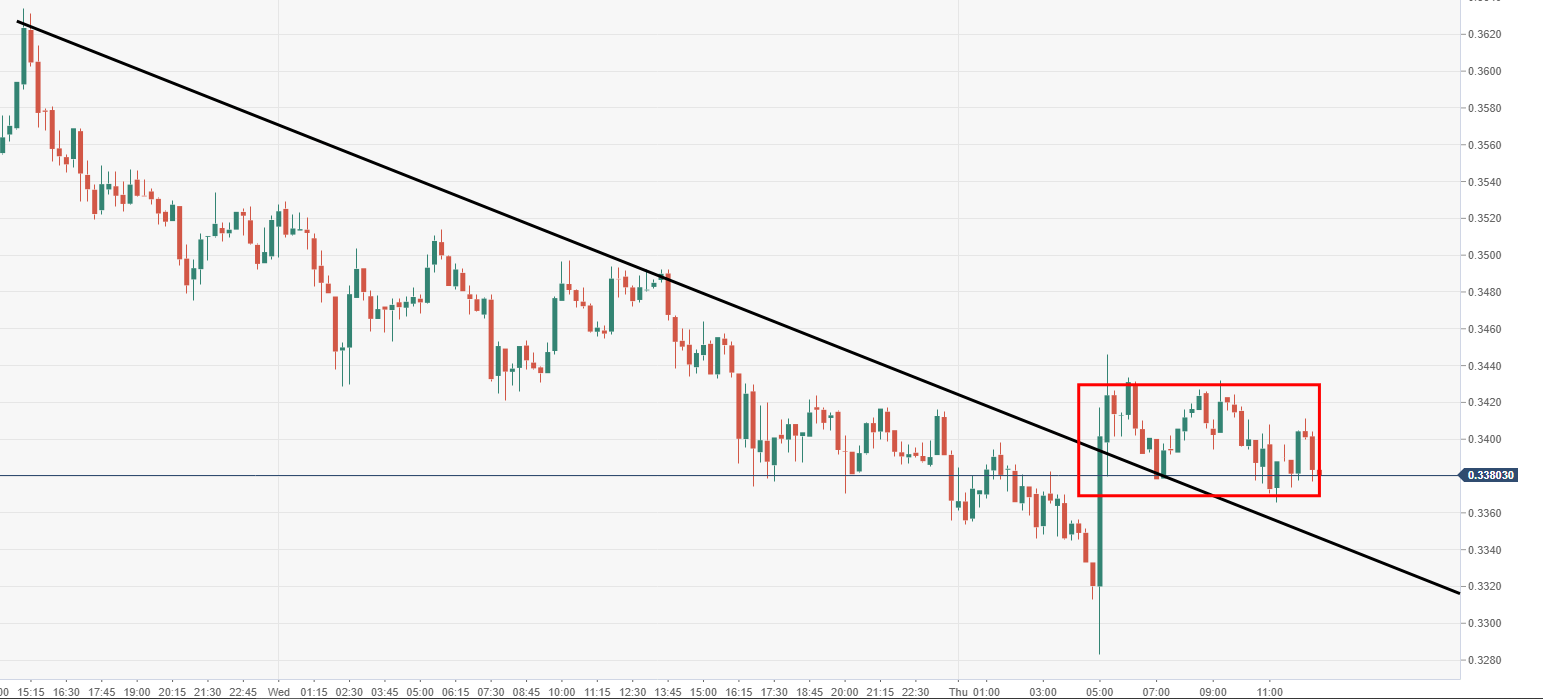
- XRP/USD price broke out to the upside, above a descending trend line acting as resistance.
- Price action is moving within a range-block, subject to anther extended move higher.

Spot rate: 3708.53
Relative change: +0.45%
High: 0.3445
Low: 0.3283
Trend: Bearish
Support 1: 0.3349, above breached descending trend line.
Support 2: 0.3305, daily pivot point support.
Support 3: 0.3244, daily pivot point support.
Resistance 1: 0.3430, upper part of current range block.
Resistance 2: 0.3479, daily pivot point resistance.
Resistance 3: 0.3591, daily pivot point resistance.
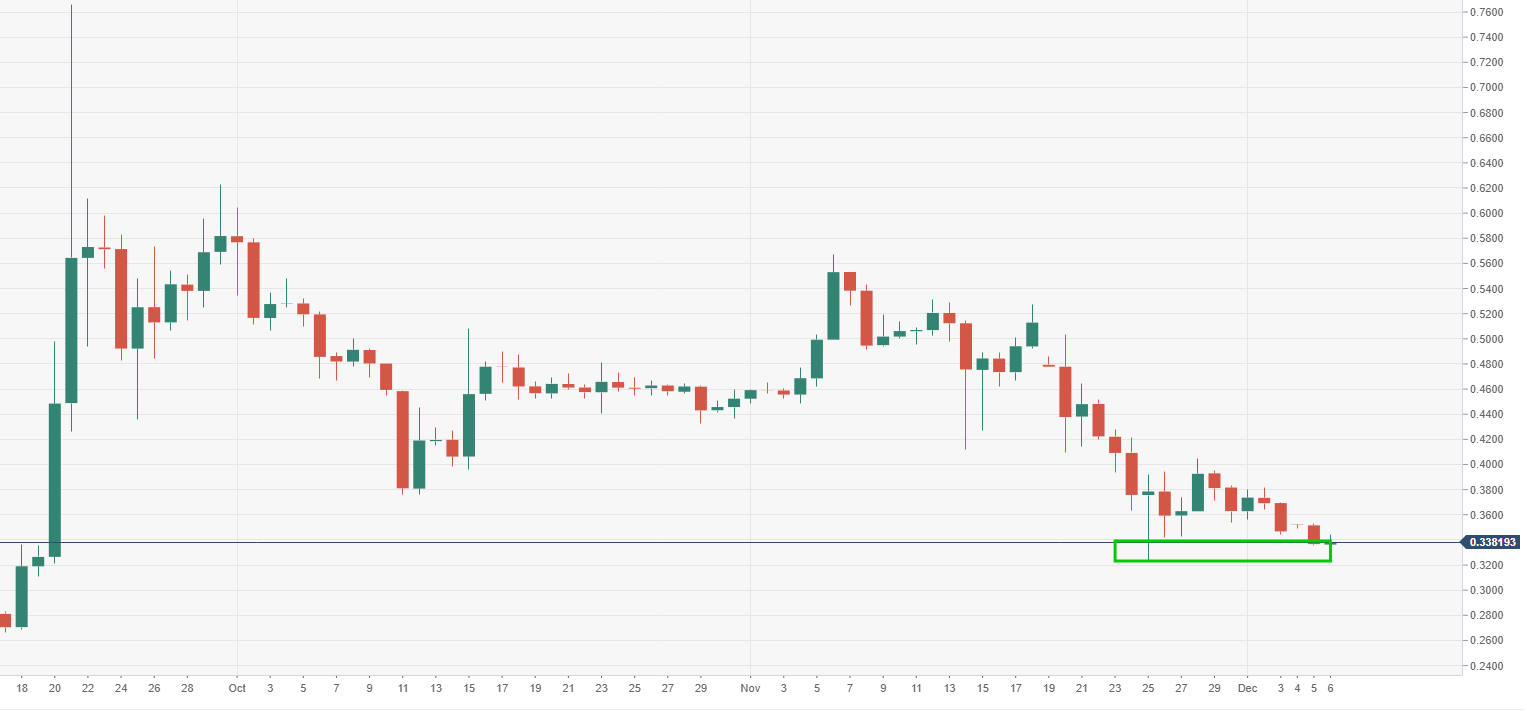
XRP/USD daily chart
- XRP has been nursing losses for the past four consecutive sessions now, lack of reversal sign. Recent highlighted bottom area protecting from further downside.
Author

Ken Chigbo
Independent Analyst
Ken has over 8 years exposure to the financial markets. He started his career as an analyst, covering a variety of asset classes; forex, fixed income, commodities and equities.


