Ripple's XRP Technical Analysis: Where next for free-falling XRP/USD?
- Ripple's XRP price on the back foot late in Wednesday's session, down some heavy 12%.
- XRP/USD flirting with strong support area of $0.4400. A breach could send price down to $0.4000.
- Price action came crashing out from a triangular pattern formation.

XRP/USD daily chart
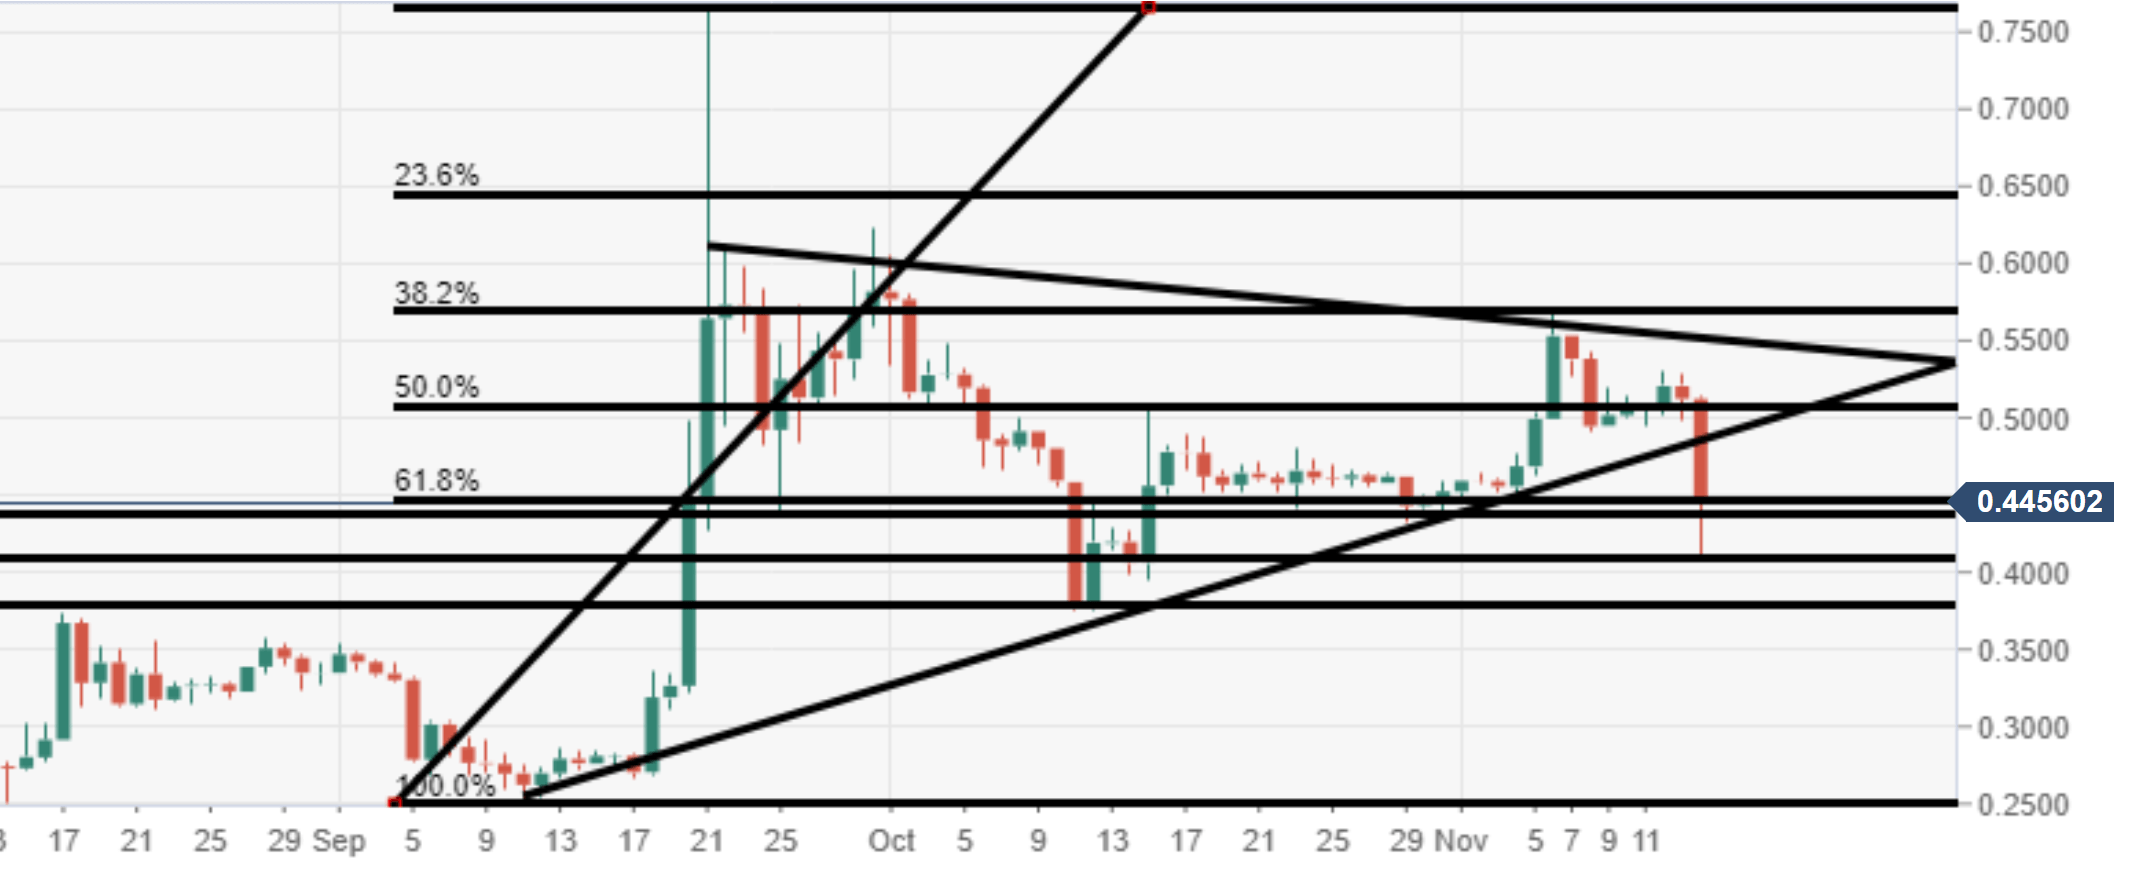
Spot rate: 0.4506
Relative change: -12.35%
High: 51.33
Low: 41.18
Trend: Bearish
Support 1: 0.4110, daily support.
Support 2: 0.4000, psychological support.
Support 3: 0.3850, 12 October low.
Resistance 1: 0.4884, underneath breached triangular pattern.
Resistance 2: 0.5080, 50% Fibonacci.
Resistance 3: 0.5311, daily resistance.
Author

Ken Chigbo
Independent Analyst
Ken has over 8 years exposure to the financial markets. He started his career as an analyst, covering a variety of asset classes; forex, fixed income, commodities and equities.
More from Ken Chigbo


