Ripple Technical Analysis: XRP/USD the daily close below game-changing $0.35, has got the bears rubbing their paws other
- Ripple has dropped just a modest 0.5% on Thursday, but the outlook is very much bearish currently.
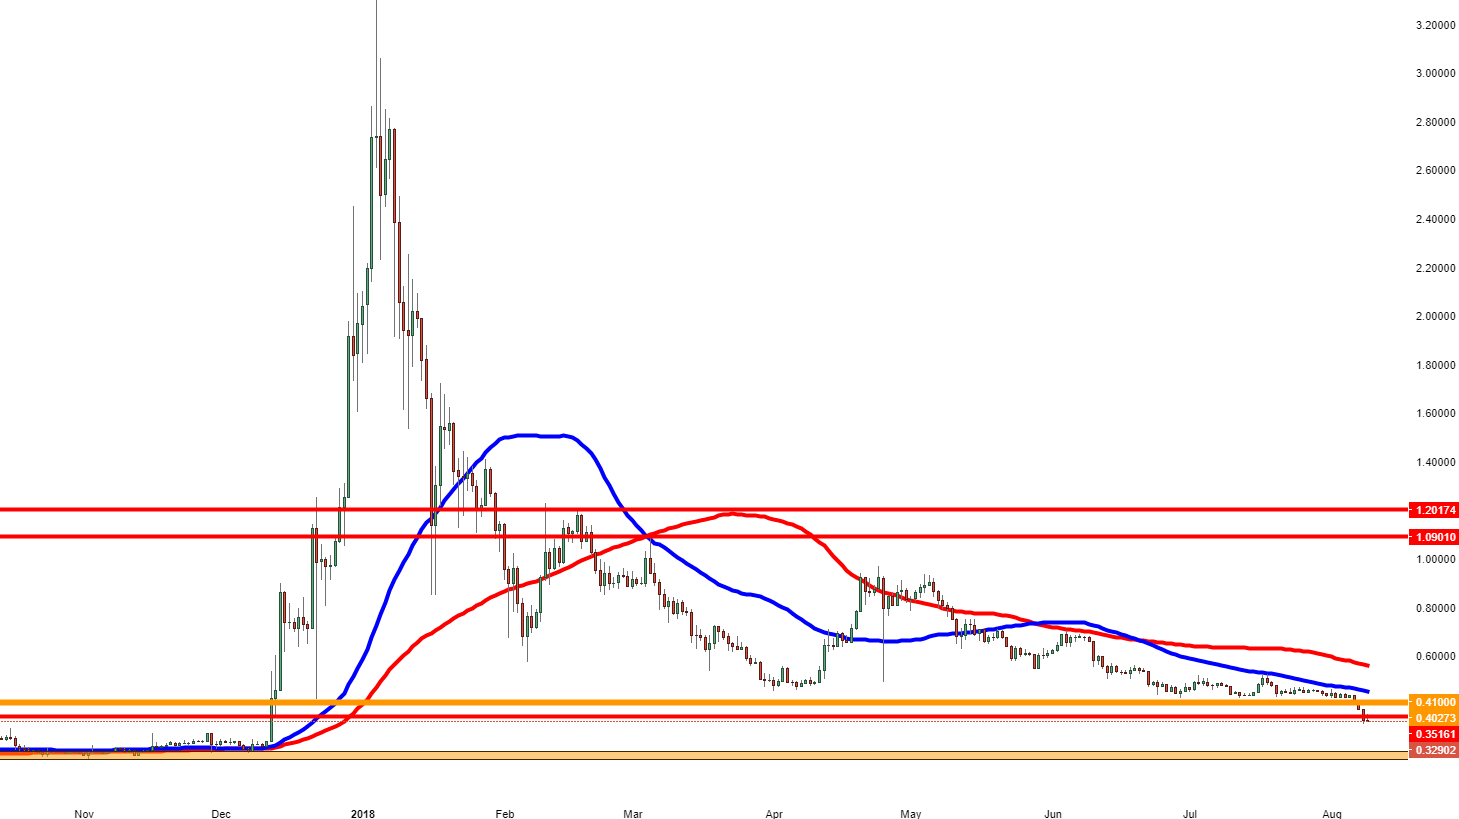
- XRP/USD on Wednesday, closed below the key $0.35 level, exposing it to further selling pressure.

XRP/USD daily chart
Spot rate: 0.33067
Relative change: -0.51%
High: 0.35712
Low: 0.33034
Trend: Bearish
Support 1: 0.30000, 16th October 201 high.
Support 2: 0.27950, top area seen on 28th/29th November.
Support 3: 0.20000, strong area of demand.
Resistance 1: 0.35000, previous support, 13th December low/wick.
Resistance 2: 0.40250, new resistance likely to be seen, given previous support.
Resistance 3: 0.4100, 22nd December 2017 low, during big bull run period.
Author

Ken Chigbo
Independent Analyst
Ken has over 8 years exposure to the financial markets. He started his career as an analyst, covering a variety of asset classes; forex, fixed income, commodities and equities.


