- XRP/USD is currently priced at $0.309 as bears take control of the market.
- The 4-hour chart shows that the SMA 50 curve is about to cross over the SMA 20.
XRP/USD daily chart
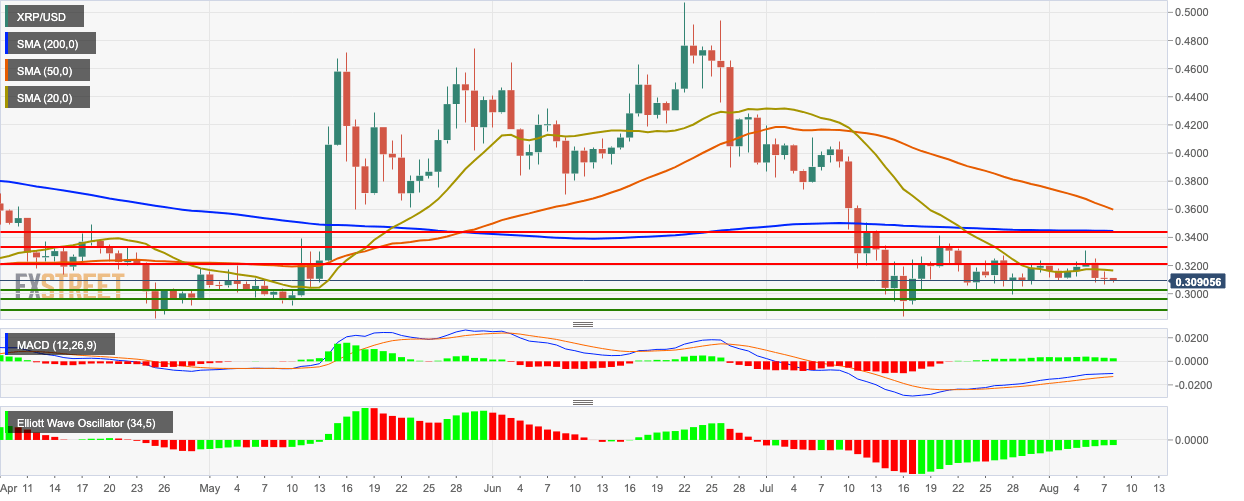
XRP/USD daily chart is on the course of having three straight bearish days and is currently consolidating in a flag formation. Currently, XRP/USD is priced at $0.309. The price is trending below the 20-day simple moving average (SMA 20), SMA 50 and SMA 200 curves. The moving average convergence/divergence (MACD) indicator shows decreasing bullish momentum. The Elliot oscillator shows 14 straight bullish sessions.
XRP/USD 4-hour chart
The 4-hour XRP/USD price was trending in the green Ichimoku cloud before it had a bearish breakout. The SMA 50 curve has crossed over the SMA 20 curve, which is a bearish signal. The Elliot oscillator for the 4-hour chart is in stark contrast to the daily chart. The Elliot indicator here shows 15 straight bearish sessions of increasing intensity.
XRP/USD hourly chart
The hourly chart is trending below the SMA 200, SMA 50 and SMA 20 curves. The second last sessions broke past the support provided by the SMA 20 curve. The 20-day Bollinger jaw is narrowing, which indicates decreasing market volatility. The relative strength index (RSI) indicator is trending around 40.
Key Levels
Note: All information on this page is subject to change. The use of this website constitutes acceptance of our user agreement. Please read our privacy policy and legal disclaimer. Opinions expressed at FXstreet.com are those of the individual authors and do not necessarily represent the opinion of FXstreet.com or its management. Risk Disclosure: Trading foreign exchange on margin carries a high level of risk, and may not be suitable for all investors. The high degree of leverage can work against you as well as for you. Before deciding to invest in foreign exchange you should carefully consider your investment objectives, level of experience, and risk appetite. The possibility exists that you could sustain a loss of some or all of your initial investment and therefore you should not invest money that you cannot afford to lose. You should be aware of all the risks associated with foreign exchange trading, and seek advice from an independent financial advisor if you have any doubts.
Recommended Content
Editors’ Picks
Ripple wipes out weekly gains, experts comment on role of Ripple stablecoin
Ripple declined to $0.52 on Thursday, erasing all gains registered earlier this week. Ripple SVP Eric van Miltenburg’s comments on the firm’s stablecoin, and how it is expected to benefit the XRP Ledger and native token XRP have raised concerns among crypto experts.
Hedera HBAR slips nearly 10% after air is cleared on mistaken link with giant BlackRock
HBAR price is down nearly 10% on Thursday, partly erasing gains inspired by the misinterpreted link with BlackRock. Despite the recent correction, Hedera’s price is up 44% in the past seven days.
The reason behind Bonk’s 105% rise and if you should buy now Premium
Bonk price has shot up 105% in the past five weeks. A retracement into $0.0000216 or the $0.0000152 to $0.0000186 imbalance would be a good buying opportunity. Patient investors can expect double-digit gains from BONK that could extend up to 70%.
Injective price weakness persists despite over 5.9 million INJ tokens burned
Injective price is trading with a bearish bias, stuck in the lower section of the market range. The bearish outlook abounds despite the network's deflationary efforts to pump the price. Coupled with broader market gloom, INJ token’s doomed days may not be over yet.
Bitcoin: BTC post-halving rally could be partially priced in Premium
Bitcoin (BTC) price briefly slipped below the $60,000 level for the last three days, attracting buyers in this area as the fourth BTC halving is due in a few hours. Is the halving priced in for Bitcoin? Or will the pioneer crypto note more gains in the coming days?