Ripple technical analysis: XRP/USD has a bullish start to Saturday following two straight bearish days
- XRP/USD has gone up from $0.294 to $0.296 as it looks to re-enter the $0.30-zone.
- The daily chart faces strong resistance at $0.314.

XRP/USD daily chart
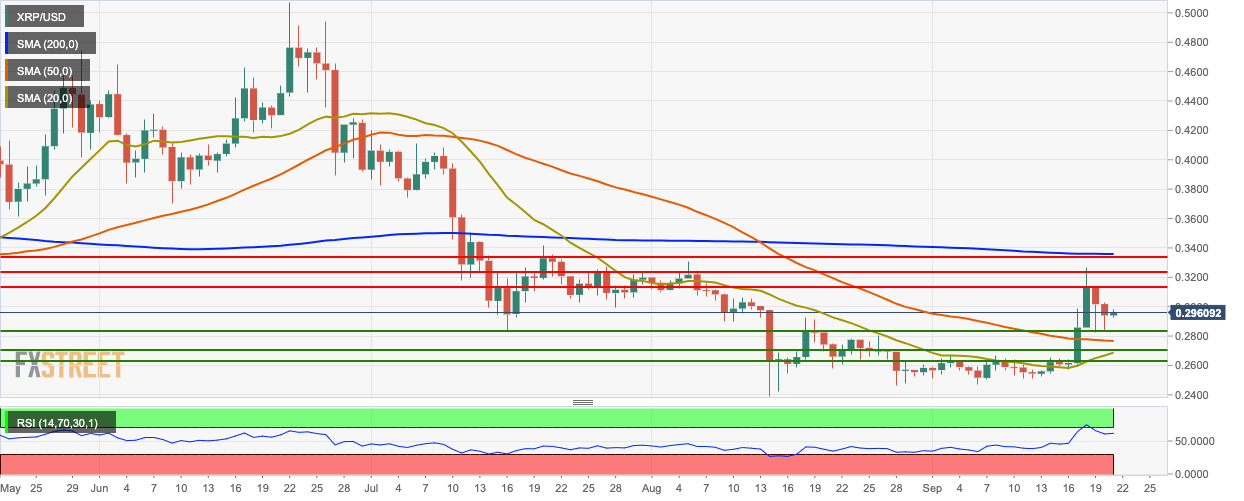
After getting thwarted at the $0.314 resistance line, the bulls lost momentum and the bears were able to take XRP/USD down to $0.294, over the last two days. However, the bulls have taken the price back up to $0.296 in the early hours of Saturday. The price is trending above the 20-day Simple Moving Average (SMA 20) and SMA 50 curves, while it is below the SMA 200 curve. The Relative Strength Index (RSI) indicator was trending in the overbought zone before it dropped to 64.
XRP/USD four-hour chart
-637046310109950841.png)
The four-hour chart shows us that XRP/USD has had a bullish breakout from the triangle formation. The 20-day Bollinger Jaw has narrowed, indicating decreasing market volatility. The four-hour price is trending below the SMA 20 curve. The Elliott Oscillator shows us five straight bearish sessions of increasing intensity.
XRP/USD hourly chart
-637046310428864620.png)
The hourly XRP/USD chart is trending inside the green Ichimoku Cloud and has found resistance at the SMA 50 curve. The Moving Average Convergence/Divergence (MACD) indicator shows increasing bullish momentum.
Key Levels
Author

Rajarshi Mitra
Independent Analyst
Rajarshi entered the blockchain space in 2016. He is a blockchain researcher who has worked for Blockgeeks and has done research work for several ICOs. He gets regularly invited to give talks on the blockchain technology and cryptocurrencies.


