|

Ripple Technical Analysis: XRP/USD bears in control of the market

XRP/USD Daily Chart

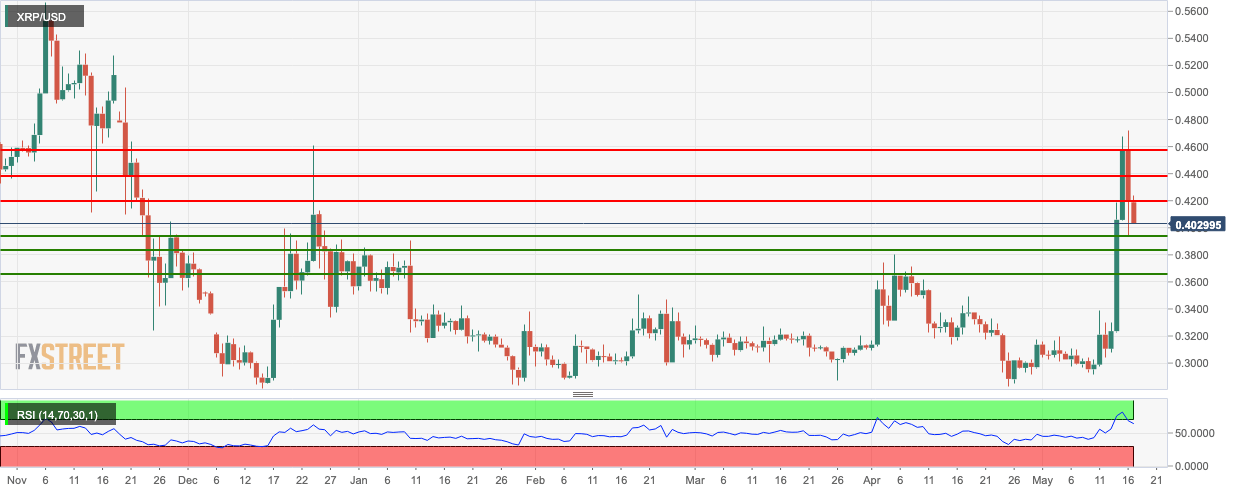
  • XRP/USD went down from $0.419 to $0.405 in the early hours of Friday.
  • The nearest support level is at $0.395.
  • The SMA 20 curve is about to crossover with the SMA 50 curve, which is a bullish sign.
  • The relative strength index (RSI) indicator has crept out of the overbought zone.

XRP/USD 4-Hour Chart

  • The 4-hour price was trending upwards in a channel formation before the price took a dip.
  • The market is prime for a bearish breakout from the triangle formation.
  • The Elliot wave oscillator shows six consecutive bearish sessions.
  • The Ichimoku indicator shows that near-term sentiment will be bearish as well.

XRP/USD Hourly Chart

  • The 20-day Bollinger band shows decreasing market volatility.
  • The price is currently trending in the lower half of the Bollinger band.
  • The moving average convergence/divergence shows sustained bearish momentum.
  • The SMA 50 curve has crossed over with the SMA 20 curve, which is a bearish sign.

Key Levels

XRP/USD

Overview
Today last price0.4012
Today Daily Change-0.0181
Today Daily Change %-4.32
Today daily open0.4193
 
Trends
Daily SMA200.3239
Daily SMA500.3272
Daily SMA1000.3202
Daily SMA2000.3483
Levels
Previous Daily High0.4716
Previous Daily Low0.3942
Previous Weekly High0.3107
Previous Weekly Low0.2917
Previous Monthly High0.3803
Previous Monthly Low0.2827
Daily Fibonacci 38.2%0.4238
Daily Fibonacci 61.8%0.442
Daily Pivot Point S10.3852
Daily Pivot Point S20.351
Daily Pivot Point S30.3078
Daily Pivot Point R10.4625
Daily Pivot Point R20.5057
Daily Pivot Point R30.5398

Author

Rajarshi Mitra

Rajarshi Mitra

Independent Analyst

Rajarshi entered the blockchain space in 2016. He is a blockchain researcher who has worked for Blockgeeks and has done research work for several ICOs. He gets regularly invited to give talks on the blockchain technology and cryptocurrencies.

More from Rajarshi Mitra
Share:

Editor's Picks

Dogecoin, Shiba Inu, and Pepe extend losses on bearish signals

Meme coins are facing renewed selling pressure amid fading broad risk-on sentiment so far this week, with Dogecoin, Shiba Inu, and Pepe extending their losses after recent corrections.

PI recovers from slump as investors buy the dip

Pi Network rebounds by 2% at press time on Tuesday, regaining strength after a three-day decline. A renewed interest among investors, evidenced by outflows from Centralized Exchanges, backs the short-term recovery.

Hedera extends losses as bearish sentiment dominates

Hedera price extends its losses after falling nearly 4% the previous day. Weakening on-chain and derivatives data support a bearish outlook alongside an unfavourable technical outlook, suggesting a deeper correction for HBAR.

Top Crypto Losers: BCH, HYPE, PUMP extend losses as Bitcoin drops below $64,000

Altcoins, including Bitcoin Cash, Hyperliquid, and Pump.fun, are leading losses over the last 24 hours as Bitcoin falls below $64,000 on Tuesday. The technical outlook for BCH, HYPE, and PUMP flags downside risk amid broader market selling.

Bitcoin Price Annual Forecast: BTC holds long-term bullish structure heading into 2026

Bitcoin (BTC) is wrapping up 2025 as one of its most eventful years, defined by unprecedented institutional participation, major regulatory developments, and extreme price volatility.

Bitcoin: No recovery in sight

Bitcoin (BTC) price continues to trade within a range-bound zone, hovering around $67,000 at the time of writing on Friday, and falling slightly so far this week, with no signs of recovery.