Ripple Technical Analysis: XRP/USD bears force price to smash out from a rising channel formation
- Ripple's XRP price on Friday trading in the red by over 1% in the late part of the day.
- XRP/USD is remains subject to further downside risks, given price behavior.

XRP/USD 15-minute chart
- Price action crashes out from ascending channel formation seen via the 15-minute chart view.
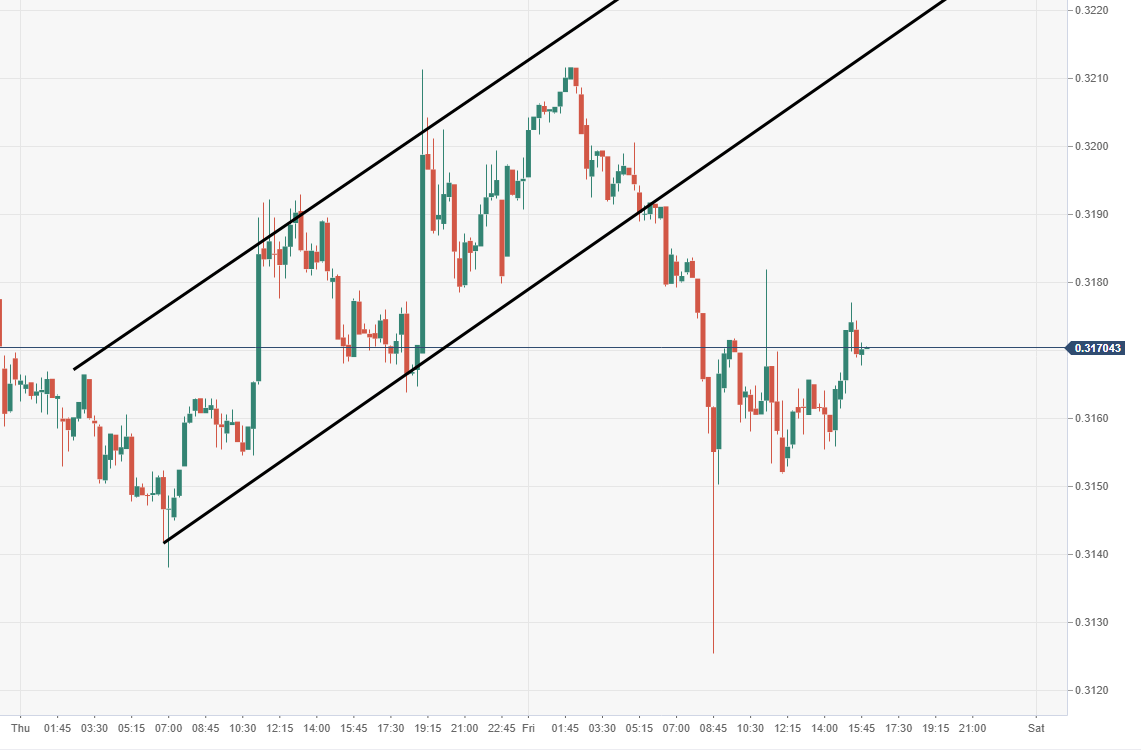
Spot rate: 0.3167
Relative change: -1.30%
High: 0.3211
Low: 0.3150
Trend: Bearish
Support 1: 0.3152, daily pivot point support.
Support 2: 0.3108, daily pivot point support.
Support 3: 0.3078, daily pivot point support.
Resistance 1: 0.3225, daily pivot point resistance.
Resistance 2: 0.3255, daily pivot point resistance.
Resistance 3: 0.3298, daily pivot point resistance.
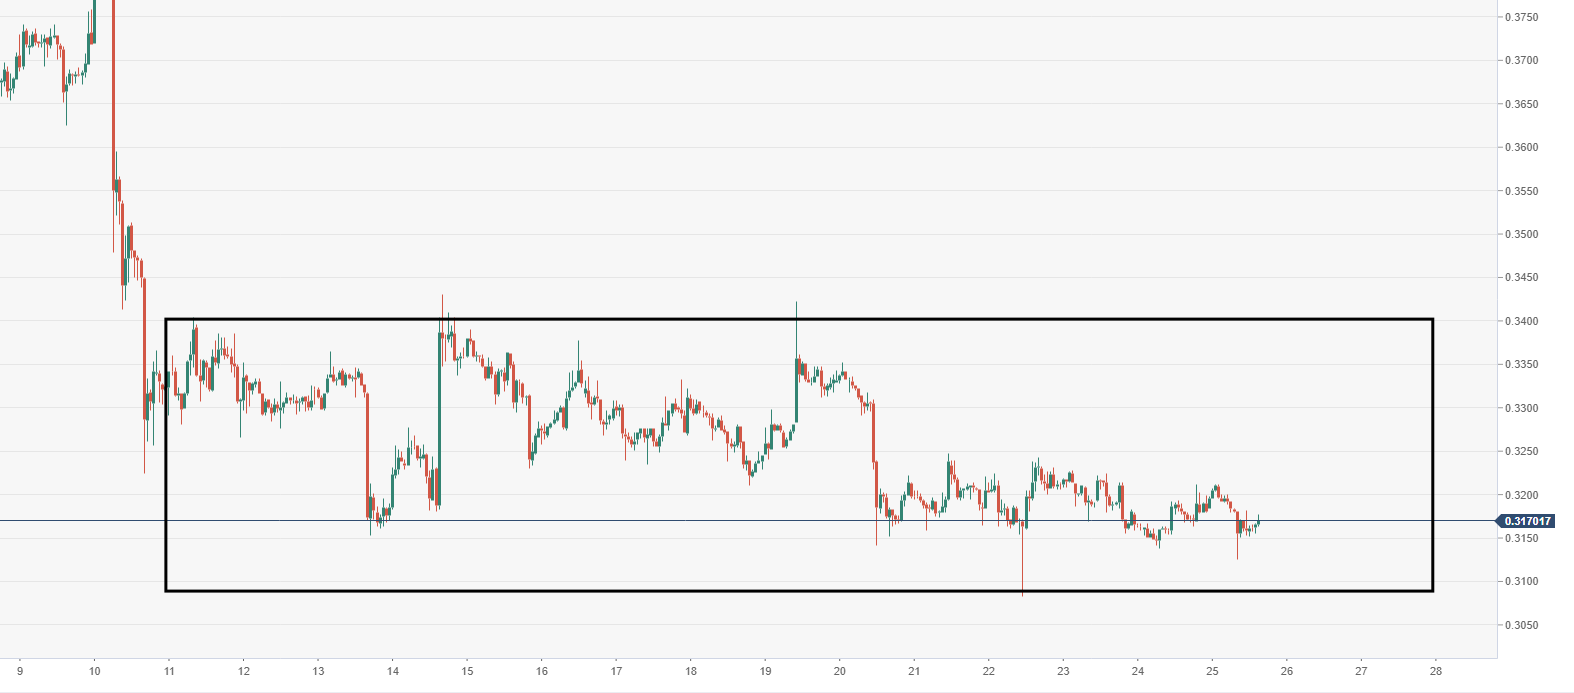
XRP/USD 60-minute chart
- XRP/USD continues to bounce within the confinements of a range-block formation.
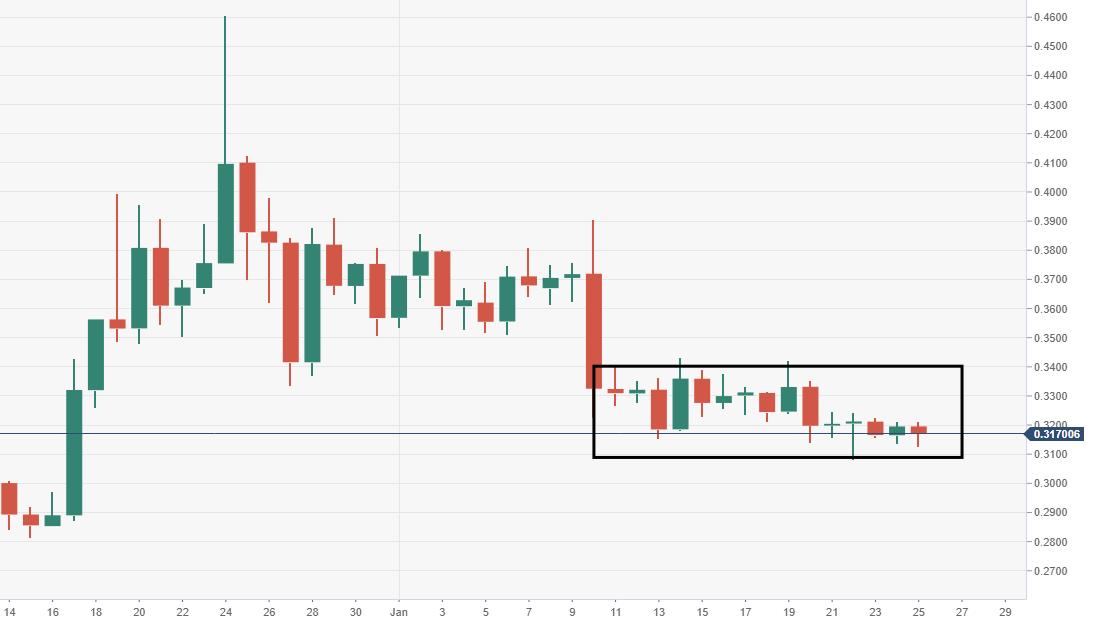
XRP/USD daily chart
- Price action remains moving within a bearish range-block formation, vulnerable to downside risks.
Author

Ken Chigbo
Independent Analyst
Ken has over 8 years exposure to the financial markets. He started his career as an analyst, covering a variety of asset classes; forex, fixed income, commodities and equities.


