Ripple Price Prediction: XRP on-chain metrics scream buy as upswing to $1 looms
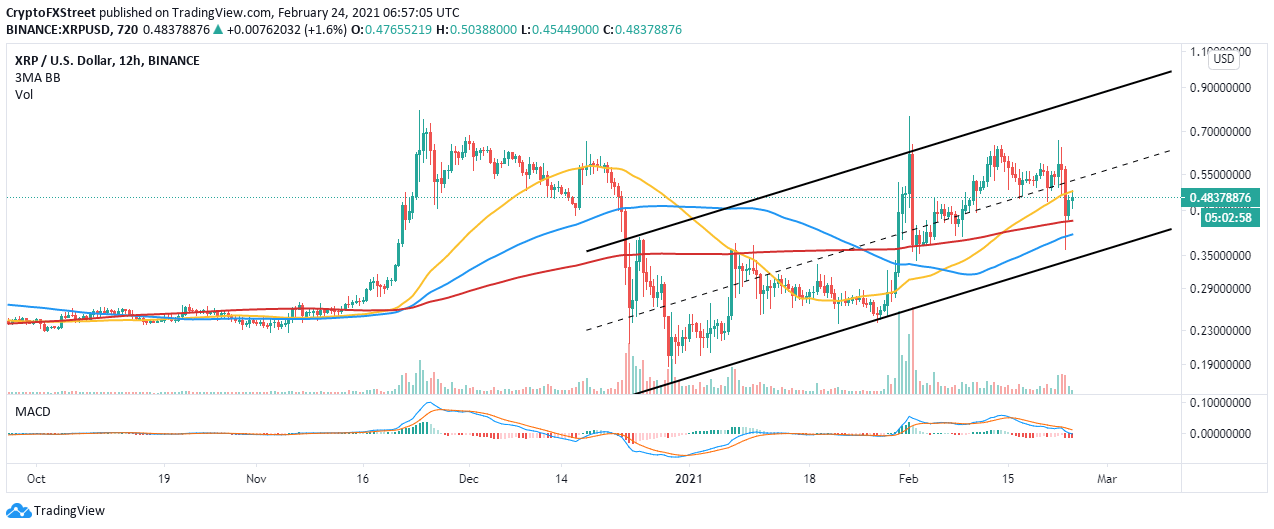
- Ripple bounces off in preparation for massive recovery above the ascending channel middle boundary.
- The MVRV on-chain metric model shows that XRP is back in the buy zone.
- A correction will come into the picture if Ripple fails to close the day above the 4-hour 200 SMA.

Ripple is nurturing an uptrend, following the recent breakdown to $0.35. The losses XRP suffered spread across the board in the market. Several tentative support levels did little to stop the sharp drop, including $0.55 and $0.4. Meanwhile, the cross-border token bulls have regained control, ready for another upswing to $1.
Ripple fights for another breakout
The drop to $0.35 appears to have been a blessing in disguise, allowing more investors to join the market at a lower price. XRP has recovered from the dip and now exchanging hands at $0.48. On the upside, bulls are battling the hurdle at the 50 Simple Moving Average (SMA) on the 4-hour chart.
Trading above this critical level is likely to pave the way for gains above the ascending parallel channel middle boundary. Another break above $0.55 will trigger massive buy orders in anticipation of gains eyeing $1. For now, the least resistance path is upwards, especially with the Relative Strength Index (RSI) on the 4-hour chart, bouncing off the oversold region and heading toward the midline.
XRP/USD 4-hour chart
Santiment’s MVRV on-chain model reveals that Ripple is back in the buy zone. This metric measures the average profit or loss of the cross-border tokens that moved over the last 30 days compared to the price when each of the XRP tokens last moved.
A low MVRV ratio shows that most investors are at a loss or have barely broken even on their investment, hence the unlikelihood of selling. On the other hand, when the MVRV is high most traders are usually in profit and are most likely to sell.
%20[10.15.38,%2024%20Feb,%202021]-637497486078107313.png)
Ripple MVRV chart
Consequently, improving network growth is another bullish signal. The chart below shows the recent consistent increase in the number of new addresses joining the network. Such an increase indicates that user adoption is growing and is a bullish signal for the token. Therefore, XRP is likely to continue with the uptrend in tandem with improving network growth.
%20[10.18.59,%2024%20Feb,%202021]-637497486342789862.png)
Ripple network growth
Looking at the other side of the fence
It is worth noting that Ripple’s upswing may fail to materialize if the immediate resistance at the 50 SMA on the 4-hour chart remains unshaken. Besides, the channel’s middle boundary is in line to hinder growth, adding to the selling pressure. On the downside, support at the 200 SMA must be guarded at costs to avert losses back to $0.35.
Author

John Isige
FXStreet
John Isige is a seasoned cryptocurrency journalist and markets analyst committed to delivering high-quality, actionable insights tailored to traders, investors, and crypto enthusiasts. He enjoys deep dives into emerging Web3 tren


