Ripple Price Prediction: XRP draws closer to $0.3
- Ripple breaks above the crucial resistance at $0.26, hinting at a potential rally to $0.3.
- On-chain metrics have given credibility to the bullish outlook; the uptrend seems sustainable.

Ripple has been determined to come out of a ranging channel since September. However, resistance at $0.26 has not given buyers the leeway to complete the ultimate journey to $0.3. The short-term support at $0.23 played a vital role throughout October and the first week of November. At the moment, the path of least resistance seems to be upwards now that XRP has climbed above $0.26.
Ripple on the verge of liftoff to $0.3
The cross-border cryptocurrency is trading at $0.261 at the time of writing. It has taken down the resistance at the 100-day Simple Moving Average. Support is required above this level to ensure that XRP achieves the imminent trading goal above $0.3.
It is worth noting that delay is anticipated at $0.28 as the sellers in this zone focus on diluting the buying pressure. Nonetheless, the Relative Strength Index is still rolling upwards and is yet to hit oversold conditions, hence the possibility for further growth.
-637403355106169741.png)
XRP/USD daily chart
According to Santiment, a leading provider of on-chain metrics, the number of active addresses within Ripple's network is currently at a 30-day high. A correlation exists between the number of addresses transacting on the network and price performance. A surge in addresses corresponds to an increase in XRP's value. Therefore, if the metric continues to hit higher levels in the coming week, XRP would quickly rush to $0.3.
 [11.25.18, 07 Nov, 2020]-637403355455100608.png)
Ripple 24-hour active addresses chart
Consequently, the bullish outlook is also validated by the spike in network growth. According to Santiment, the network growth metric measures the number of new addresses joining the network. A spike in network growth occurs concurrently with surging prices. Hence, the sharp increase on November 6 suggests that XRP can push the uptrend further.
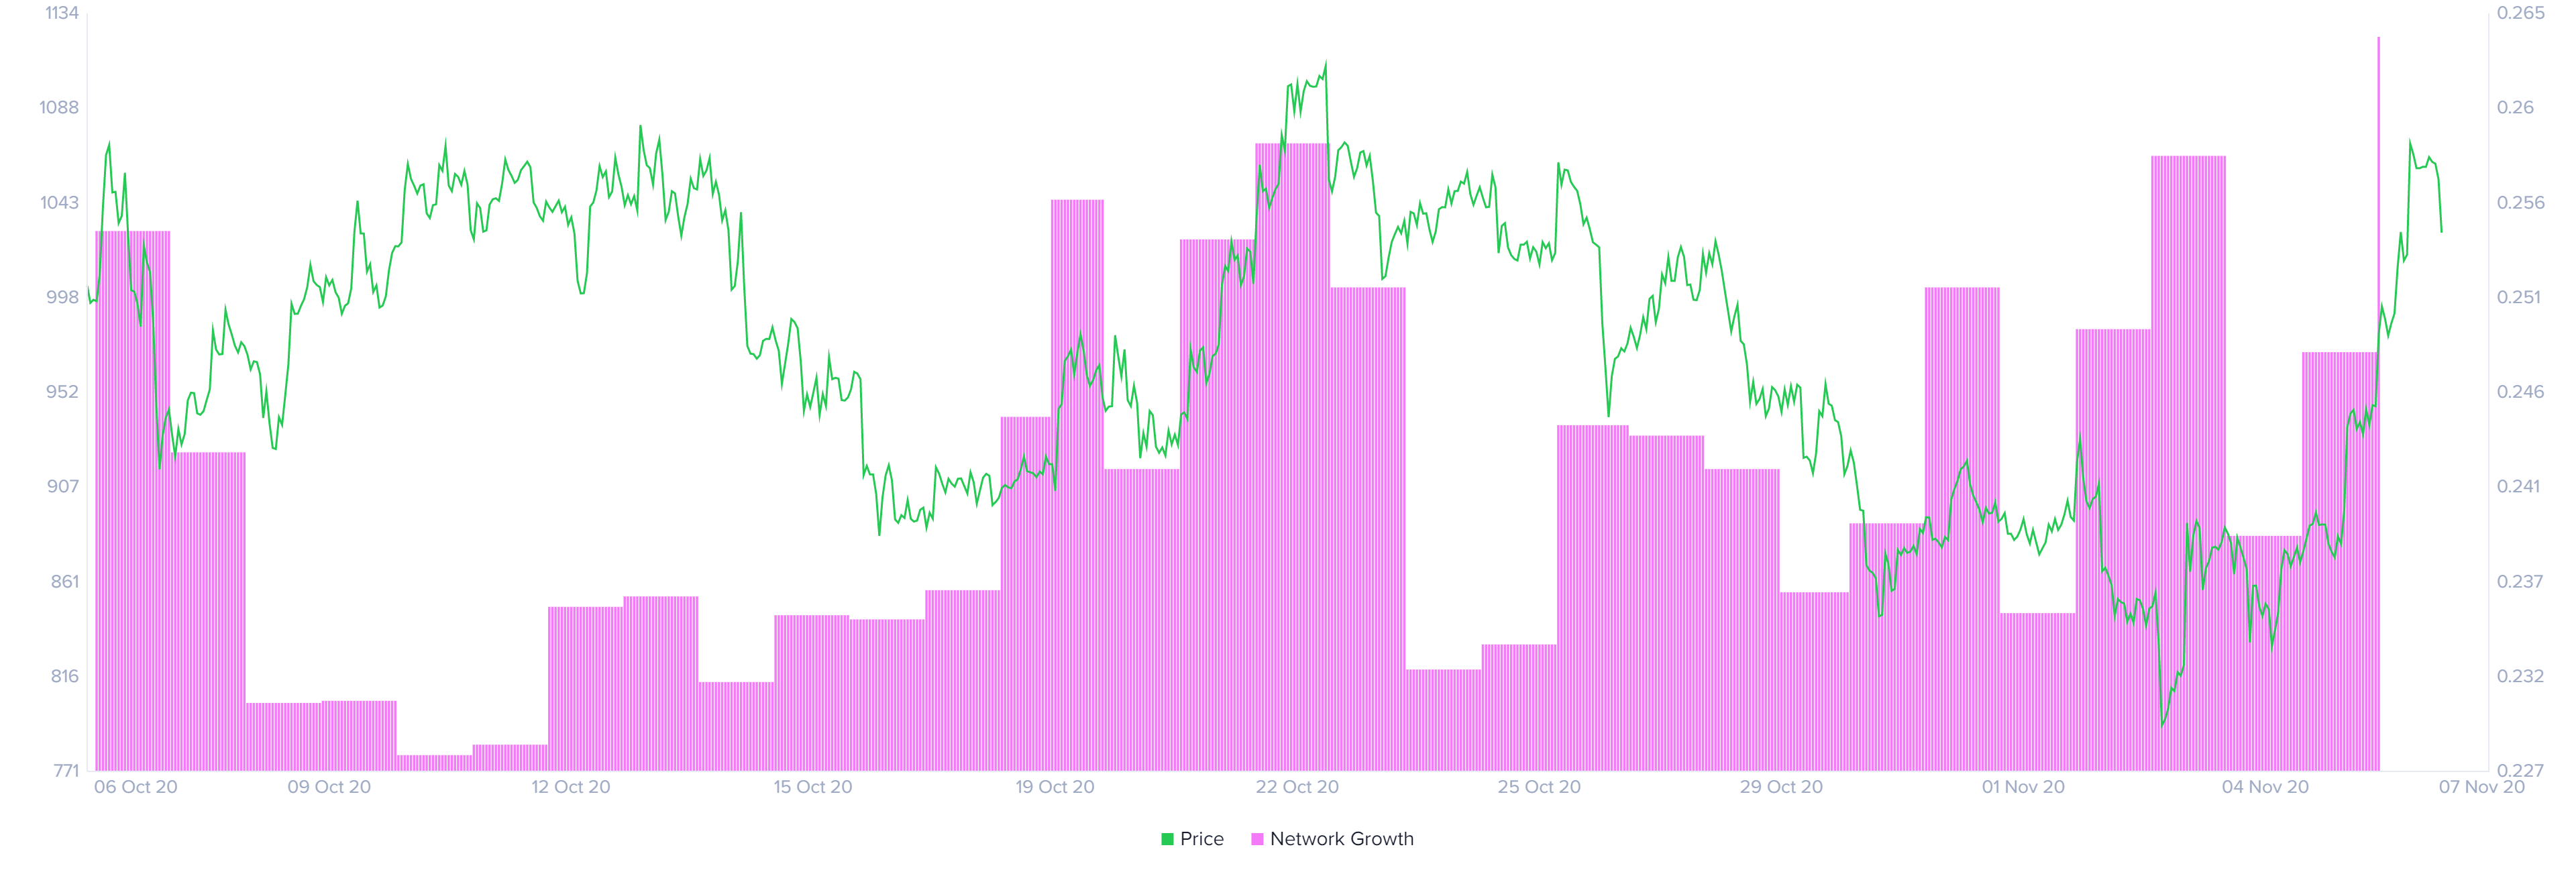
Ripple network growth chart
It is worth mentioning that consistent growth in the two on-chain metrics is usually succeeded by retracement that negatively impacts the token's value. Therefore, traders must lookout for possible correction and adjust accordingly. Simultaneously, if XRP fails to hold above the 100-day SMA, a reversal is likely to come into the picture. On the downside, $0.24 is tentative support, while the 200-day SMA could stop the declines, giving way for a rebound.
Author

John Isige
FXStreet
John Isige is a seasoned cryptocurrency journalist and markets analyst committed to delivering high-quality, actionable insights tailored to traders, investors, and crypto enthusiasts. He enjoys deep dives into emerging Web3 tren


