Ripple Price Prediction: XRP doomsday in the making pt.2
- XRP price loses support from the 8-Exponential and 21-Simple Moving Averages.
- The largest candle during September is now attributed to the bears.
- Invalidation of the bearish thesis is a breach above $0.41.

Ripple’s XRP price could show early evidence of a decline to $0.30. Key levels have been identified.
XRP price has seen better days.
Ripple’s XRP price is in an unfortunate position. Since August, the digital remittance token has lost 20% of its market value, unable to successfully retaliate against the bearish force for more than a few hours at a time. During the first trading days of August, XRP price consolidated near the mid-$0.33 zone, prompting optimism amidst speculations of a final SEC negotiation underway.
On August 6, the bears firmly rejected re-entrance into the $0.33 barrier, and the XRP lost 5% of market value within hours. The 21-day simple moving average catalyzed the decline as the evening star pattern was just below the barrier on the 4-hour time frame.
It is worth noting that the 8-day Exponential Moving Average was also breached during the decline, which is a subtle testimony of the bearish strength. As a consequence of the resistance, large bearish engulfing was printed and now stands as the largest candle printed for the entirety of September.
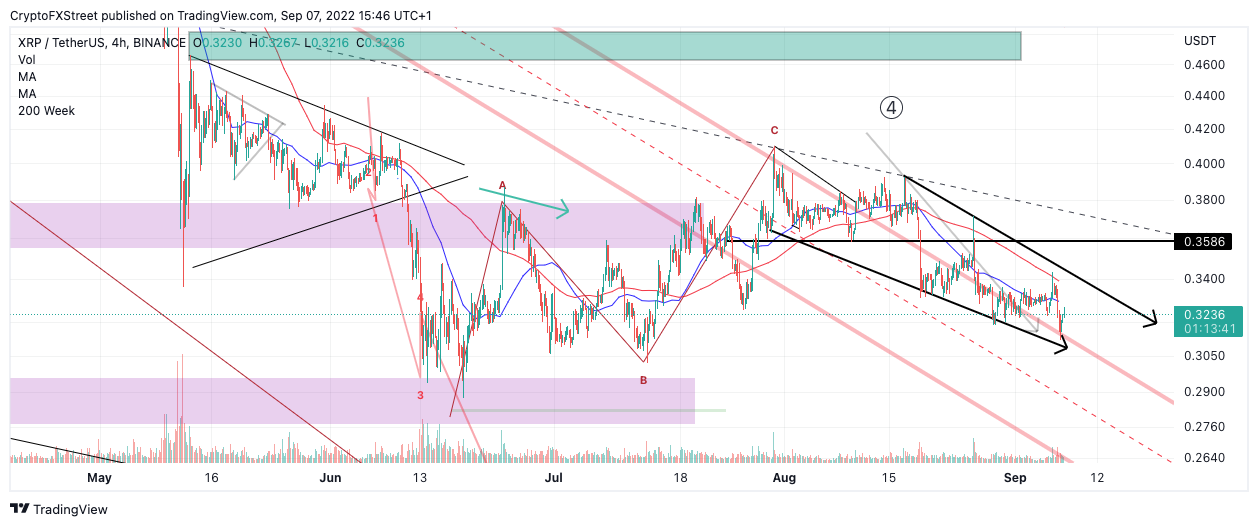
XRP USDT 4-Hour Chart
XRP price currently auctions at $0.325. If the bearish stronghold is genuine, the XRP price a sweep the lows event could already be underway. The bears could have the power to send XRP price back to sub $0.30 territory. Key levels of interest are the June 18 swing low at $0.28 and liquidity levels dating back to January of 2021 near the $0.24 and $0.21 levels. Such a decline would result in a 40% decrease from the current XRP price.
Invalidation of the bearish thesis is a breach above $0.41. If the bulls can hurdle this boundary, they could kick off an Autumn rally targeting $0.46, resulting in a 40% bullish rally from the current market value.
In the following video, our analysts deep dive into the price action of Ripple, analyzing key levels of interest in the market. -FXStreet Team
Author

Tony M.
FXStreet Contributor
Tony Montpeirous began investing in cryptocurrencies in 2017. His trading style incorporates Elliot Wave, Auction Market Theory, Fibonacci and price action as the cornerstone of his technical analysis.


