Ripple Price Prediction: XRP uptrend faces hurdles with falling network activity, whale accumulation
- XRP's drop from recent highs of $2.65 on May 12 tests the 50-day EMA support as downside risks emerge.
- XRP faces declining network activity amid subdued daily active addresses.
- Large volume holders with between 100,000 and 1 million coins cut back on their holdings as the uptrend falters.
- Strong crypto market sentiment could keep XRP above its 50-day EMA support, boosting the chances of returning to $3.00.

Ripple’s (XRP) price, trading at around $2.33, faces increasing downside risks amid muted trading on Wednesday. Despite Bitcoin (BTC) nearing all-time highs, XRP’s three-day consolidation mirrors a sluggish broader crypto market. Data from the XRP Ledger shows network activity remains low, well below the first quarter levels.
XRP faces declining interest as network activity remains muted
As the XRP price broadly consolidates above the short-term support at $2.28, attention is shifting to the XRP Ledger, which, according to Santiment, faces declining network activity.
The Daily Active Addresses metric in the chart below shows the number of newly created addresses on the protocol at approximately 33,400, representing a 95% drop from the first quarter peak of roughly 612,000.
This sharp decline coincided with the drop in the price of XRP from its first-quarter peak of $3.40 to $1.61 amid the tariff-triggered crash on April 7. While the price recovered, reaching $2.65 on May 12 before sliding to the current market rate of $2.33, engagement remains low based on the diminished number of unique addresses joining the network.
 [13-1747827810794.50.28, 21 May, 2025].png)
XRP Active Addresses metric | Source: Santiment
A persistent drop in the addresses joining the XRP Ledger translates to reduced engagement and low demand for the XRP token, stifling potential price increase.
Coincidentally, some cohorts of large volume holders, often referred to as whales, continue to offload their holdings, as illustrated by the Supply Distribution metric in the chart below.
Users with between 100,000 and 1 million coins have been shaving their holdings since the fourth quarter. This whale cohort currently accounts for 10.32% of the total supply, down from 10.76% on March 1 and 11% on November 1.
As the chart below shows, this group of investors started selling aggressively as XRP's price exploded in the fourth quarter and continued to do so in the first quarter, plausibly taking profits.
 [13-1747827833161.12.20, 21 May, 2025].png)
XRP/USD Supply Distribution chart | Source | Santiment
If this aggressive profit-taking continues, it could be difficult for bulls to sustain the uptrend, targeting a return above $3.00 in the mid-term. Moreover, the XRP futures Open Interest (RSI) has fallen to $4.59 billion from its peak of $5.52 billion on May 14.
OI refers to the total number of active derivatives contracts, such as futures or options, that are yet to be settled.
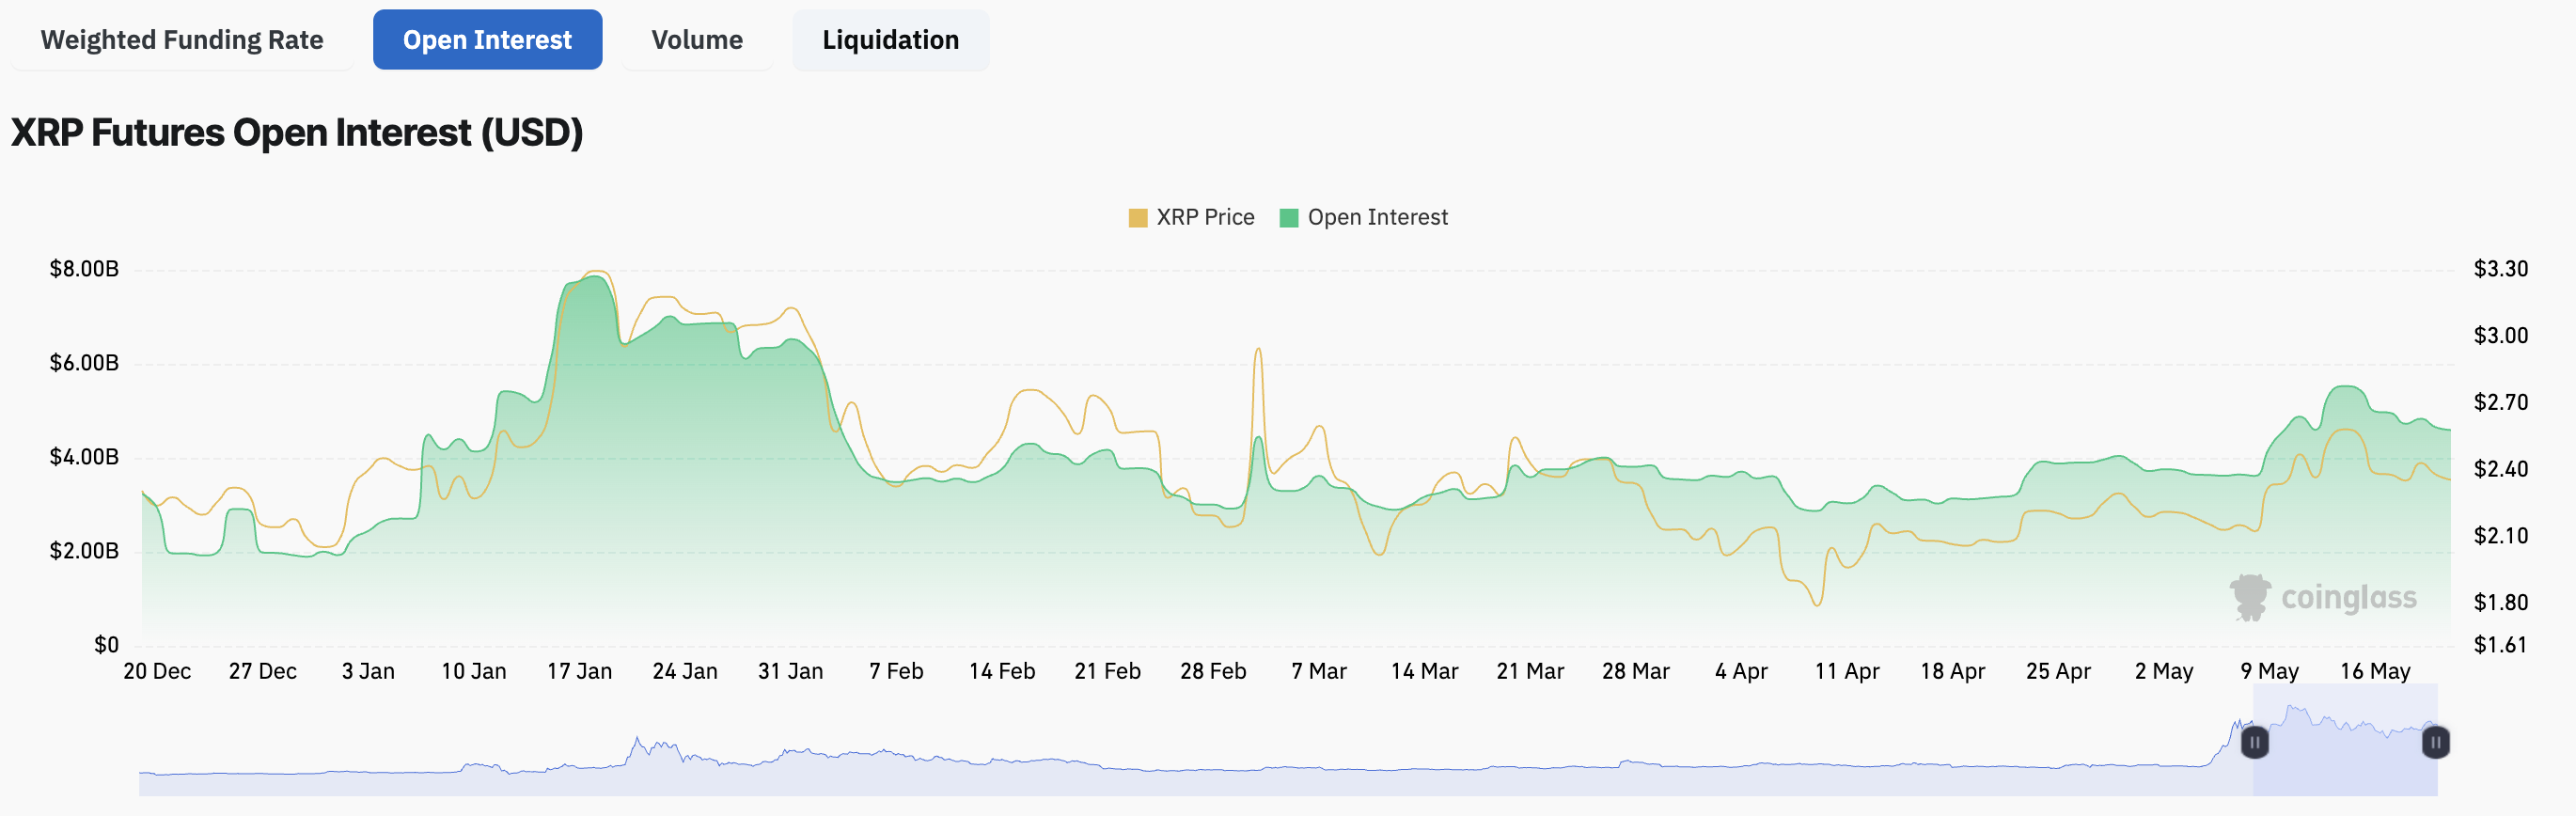
XRP futures open interest | Source| CoinGlass
The subsequent decrease in the trading volume to approximately $4.43 billion points to declining trader interest in XRP. Falling OI and declining volume and price signal shifting sentiment and bearish momentum as market participation fades.
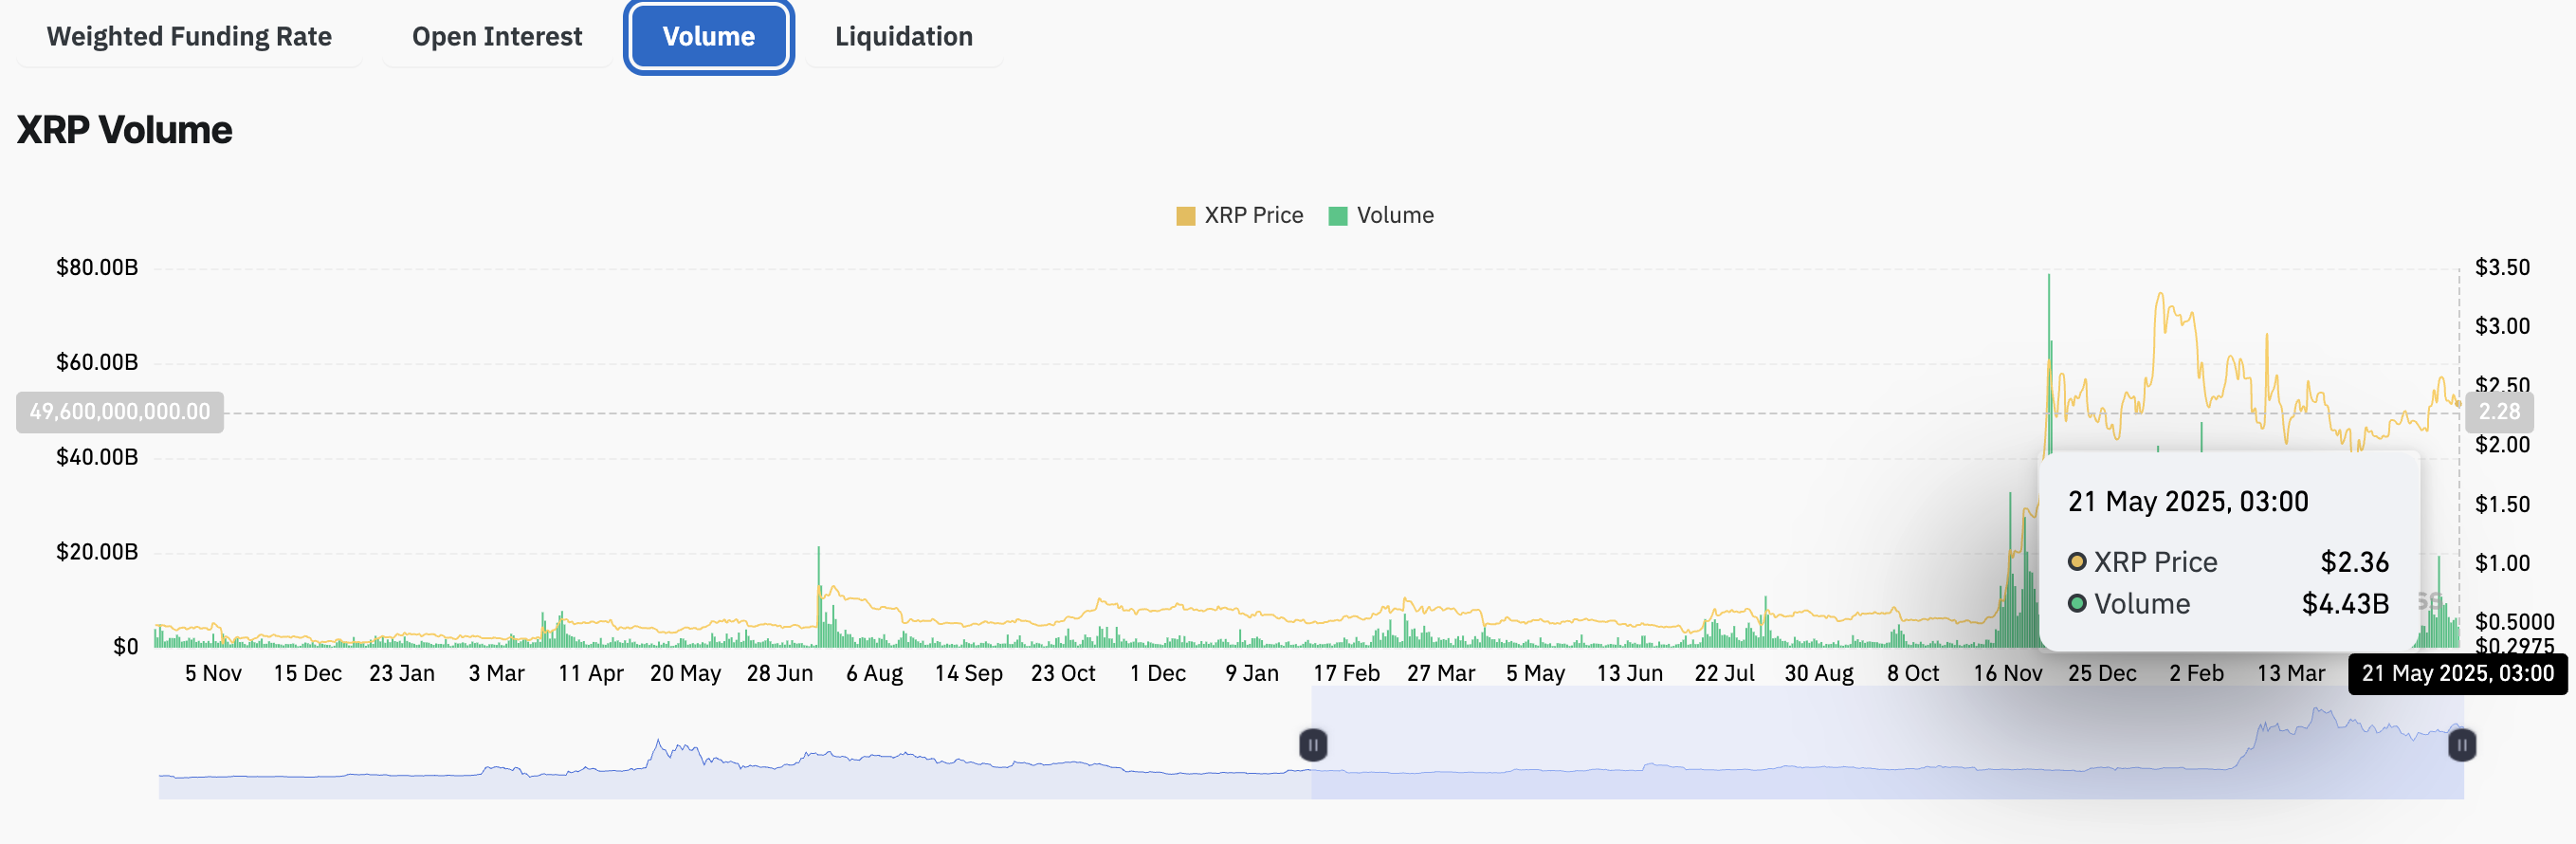
XRP futures trading volume | Source: CoinGlass
Looking ahead: Could XRP break the uptrend and accelerate losses?
XRP's price hovers above the 50-day Exponential Moving Average (EMA) support around $2.28, while bulls struggle to sustain the higher low pattern established since the recovery from the April 7 low at $1.61.
Technical indicators like the Moving Average Convergence Divergence (MACD) affirm the growing bearish grip following the rejection from May's peak of $2.65. A sell signal has been validated with the MACD line (blue) crossing below the signal line (red). If bulls fail to regain control, the expanding red histogram bars could encourage traders to sell XRP, boosting bearish momentum.
The Relative Strength Index (RSI) indicator's downward trend at 52 shows that bears are getting stronger. Further movement below the 50 midline would reinforce the sellers' influence on the token's price.
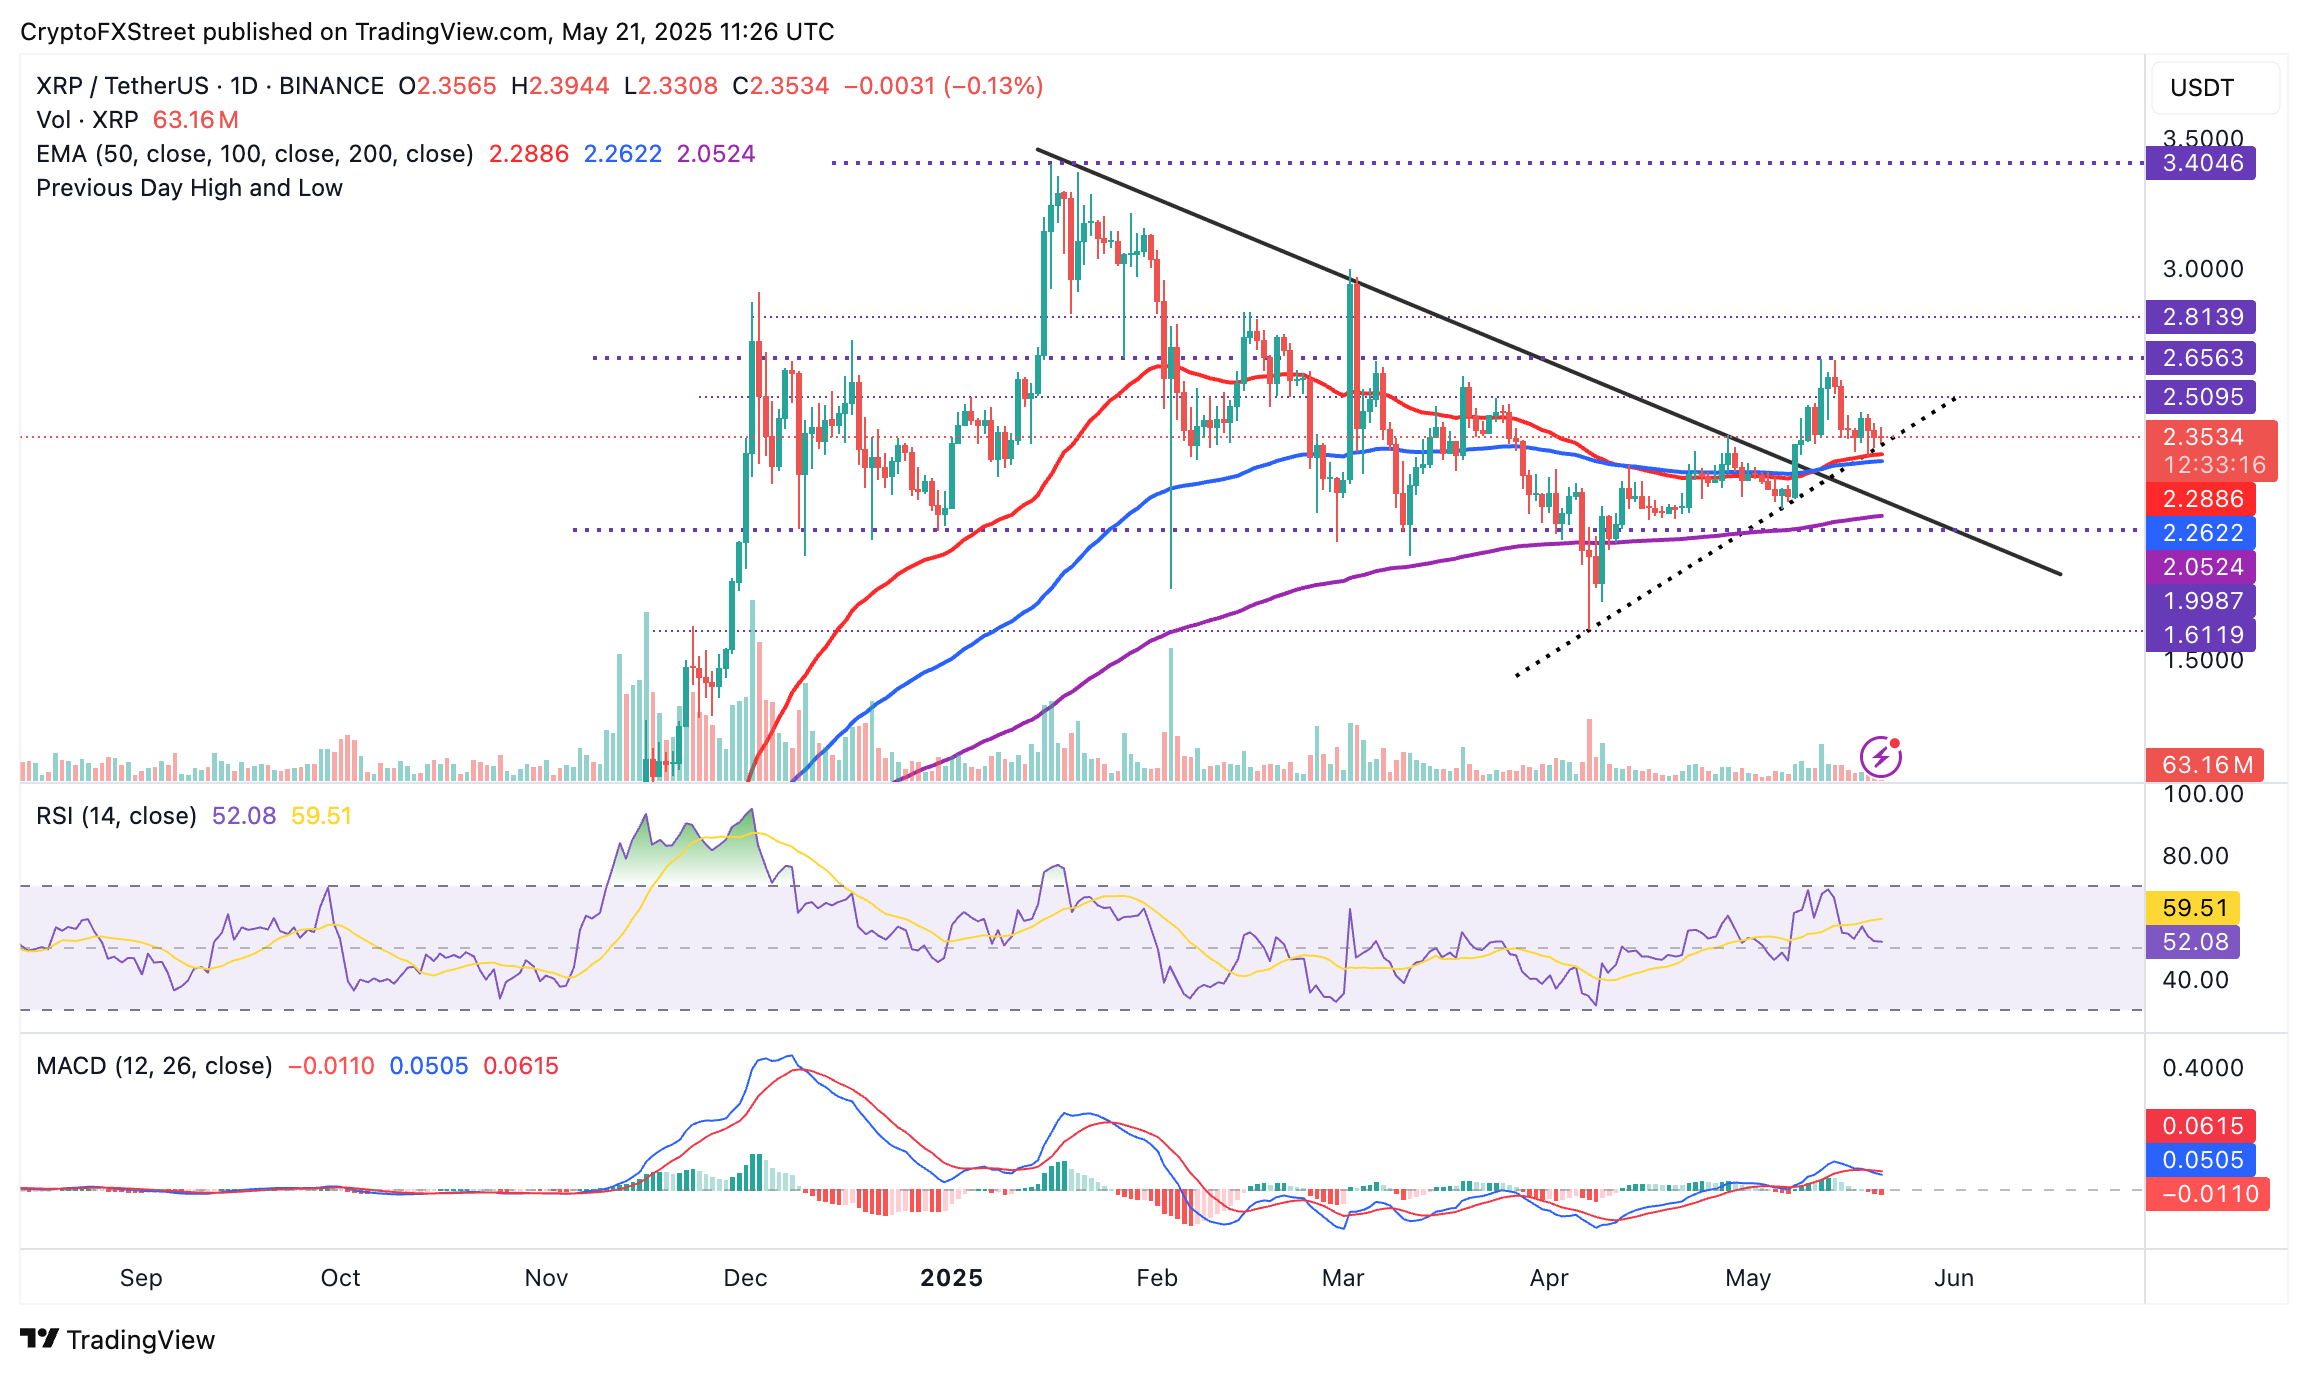
XRP/USDT daily chart
Meanwhile, the 50-day EMA at around $2.28 and the dotted ascending trendline offer initial support. Should declines intensify, traders could shift attention to lower support areas such as the 200-day EMA at $2.05 and the lowest point in April at $1.61.
Cryptocurrency prices FAQs
Token launches influence demand and adoption among market participants. Listings on crypto exchanges deepen the liquidity for an asset and add new participants to an asset’s network. This is typically bullish for a digital asset.
A hack is an event in which an attacker captures a large volume of the asset from a DeFi bridge or hot wallet of an exchange or any other crypto platform via exploits, bugs or other methods. The exploiter then transfers these tokens out of the exchange platforms to ultimately sell or swap the assets for other cryptocurrencies or stablecoins. Such events often involve an en masse panic triggering a sell-off in the affected assets.
Macroeconomic events like the US Federal Reserve’s decision on interest rates influence crypto assets mainly through the direct impact they have on the US Dollar. An increase in interest rate typically negatively influences Bitcoin and altcoin prices, and vice versa. If the US Dollar index declines, risk assets and associated leverage for trading gets cheaper, in turn driving crypto prices higher.
Halvings are typically considered bullish events as they slash the block reward in half for miners, constricting the supply of the asset. At consistent demand if the supply reduces, the asset’s price climbs.
Author

John Isige
FXStreet
John Isige is a seasoned cryptocurrency journalist and markets analyst committed to delivering high-quality, actionable insights tailored to traders, investors, and crypto enthusiasts. He enjoys deep dives into emerging Web3 tren


