Ripple Price Prediction: XRP extends run above $2.00 after Israel-Iran ceasefire
- XRP extends gains above $2.00 as markets shift focus from Middle East tensions to Fed Chair Jerome Powell.
- Powell insists that interest rate cuts can wait as the tariffs imposed by the US will likely push prices up while slowing economic activity.
- XRP eyes a technical breakout toward $3.00, backed by a robust derivatives market.

Ripple (XRP) sustains a bullish outlook following the macro-driven crash to $1.90 on Sunday, trading at around $2.17 at the time of writing on Tuesday. A breakout to $2.50 seems highly likely if the sentiment backed recovery extends amid easing geopolitical tensions after Israel and Iran signed a ceasefire agreement.
Interest rate cuts can wait, says Fed Chair Jerome Powell
United States (US) Federal Reserve (Fed) Chair Jerome Powell said via notes prepared ahead of his testimony before the House Financial Services Committee that “increases in tariffs this year are likely to push up prices and weigh on economic activity.”
Despite the push by US President Donald Trump for interest rate cuts, Powell has maintained that the central bank needs more time to assess the impact of tariffs on inflation.
“For the time being, we are well positioned to wait to learn more about the likely course of the economy before considering any adjustments to our policy stance,” Powell added in the statement.
Meanwhile, XRP’s recovery from the $1.90 support level can be directly attributed to fresh risk-on sentiment as geopolitical tensions show signs of easing.
Following the sell-off over the weekend, which triggered massive liquidations across the board, Open Interest (OI) increased nearly 5% to $3.74 billion. A subsequent surge in trading volume by over 10% to approximately $9.5 billion indicates a significant increase in market activity.
Short liquidations, valued at around $9.3 million over the last 24 hours, surpassed longs at $3.5 million, hinting at a short squeeze recovery. Traders on Binance have a strong bullish bias as indicated by the long-to-short ratio of 2.3829.
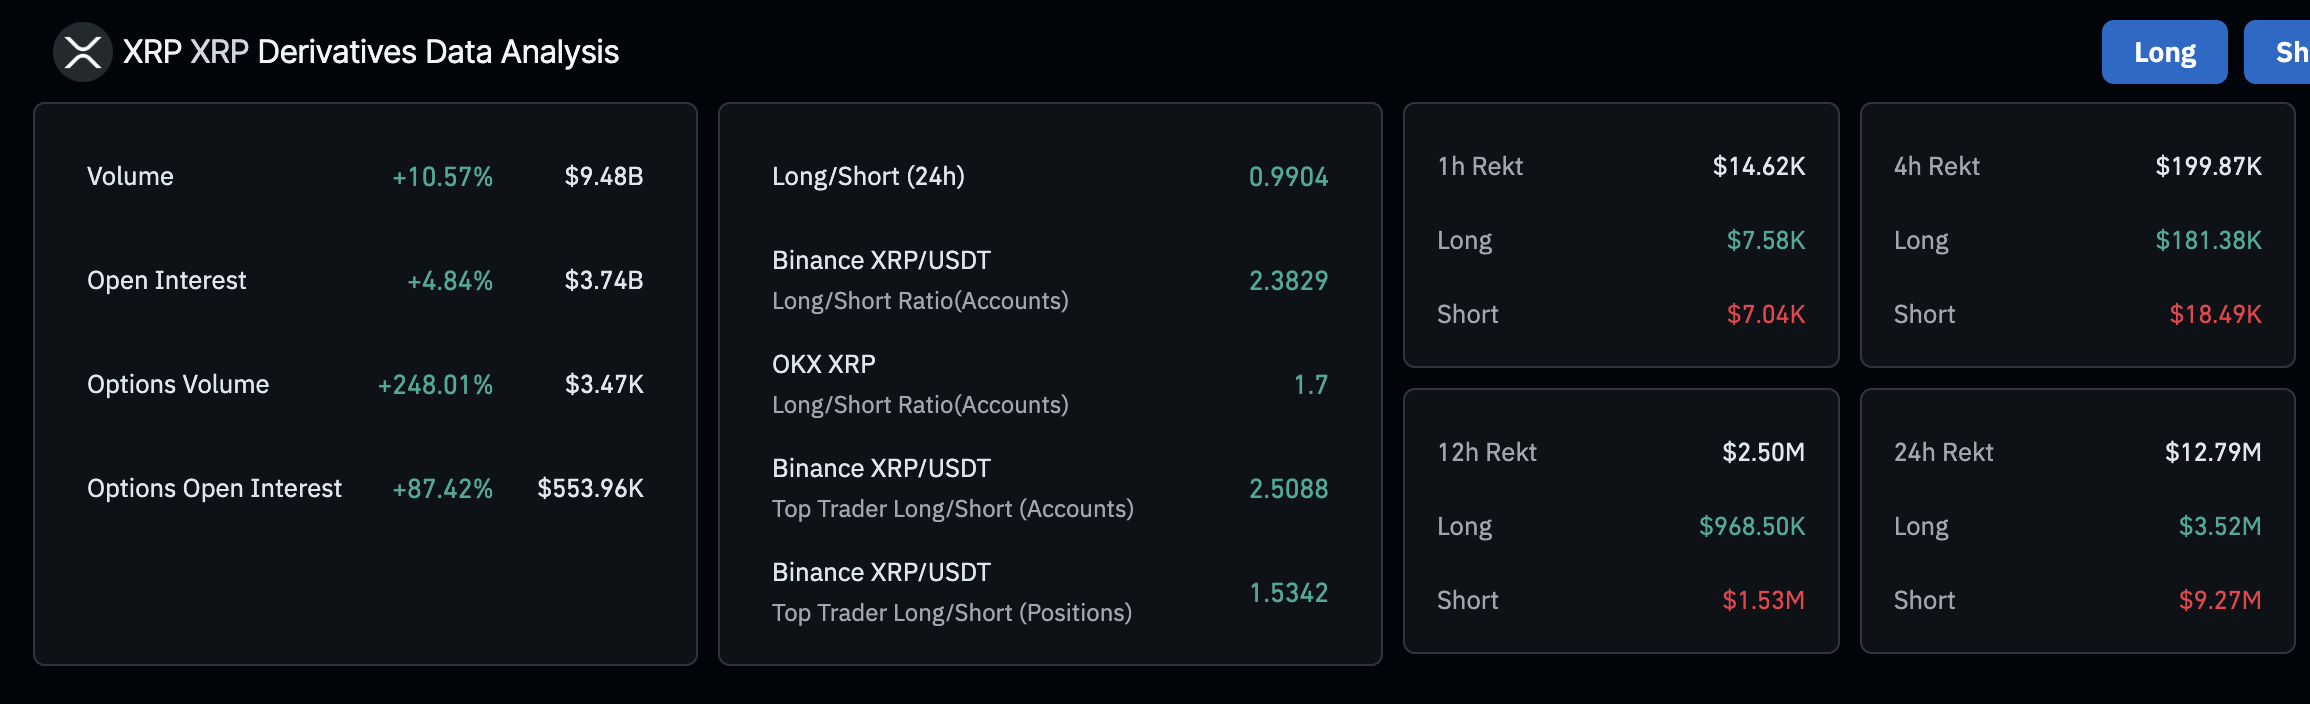
XRP derivatives market data | Source: CoinGlass
Technical outlook: XRP could extend gains
The price of XRP holds significantly above the weekly moving averages, including the 50-week Exponential Moving Average (EMA) at $1.82, the 100-week EMA at $1.38 and the 200-week EMA at $1.01. This technical position cements the bullish structure despite the extended consolidation between April’s support at $1.61 and the May peak of $2.65.
Steady gains beyond the descending trendline resistance, as illustrated by the weekly chart below, would tighten the bullish grip. The Relative Strength Index (RSI) indicator’s reversal above the midline signals stable bullish momentum.
Beyond the trendline resistance, key levels of interest to traders are the seller congestion levels at $2.50, which were tested in May.
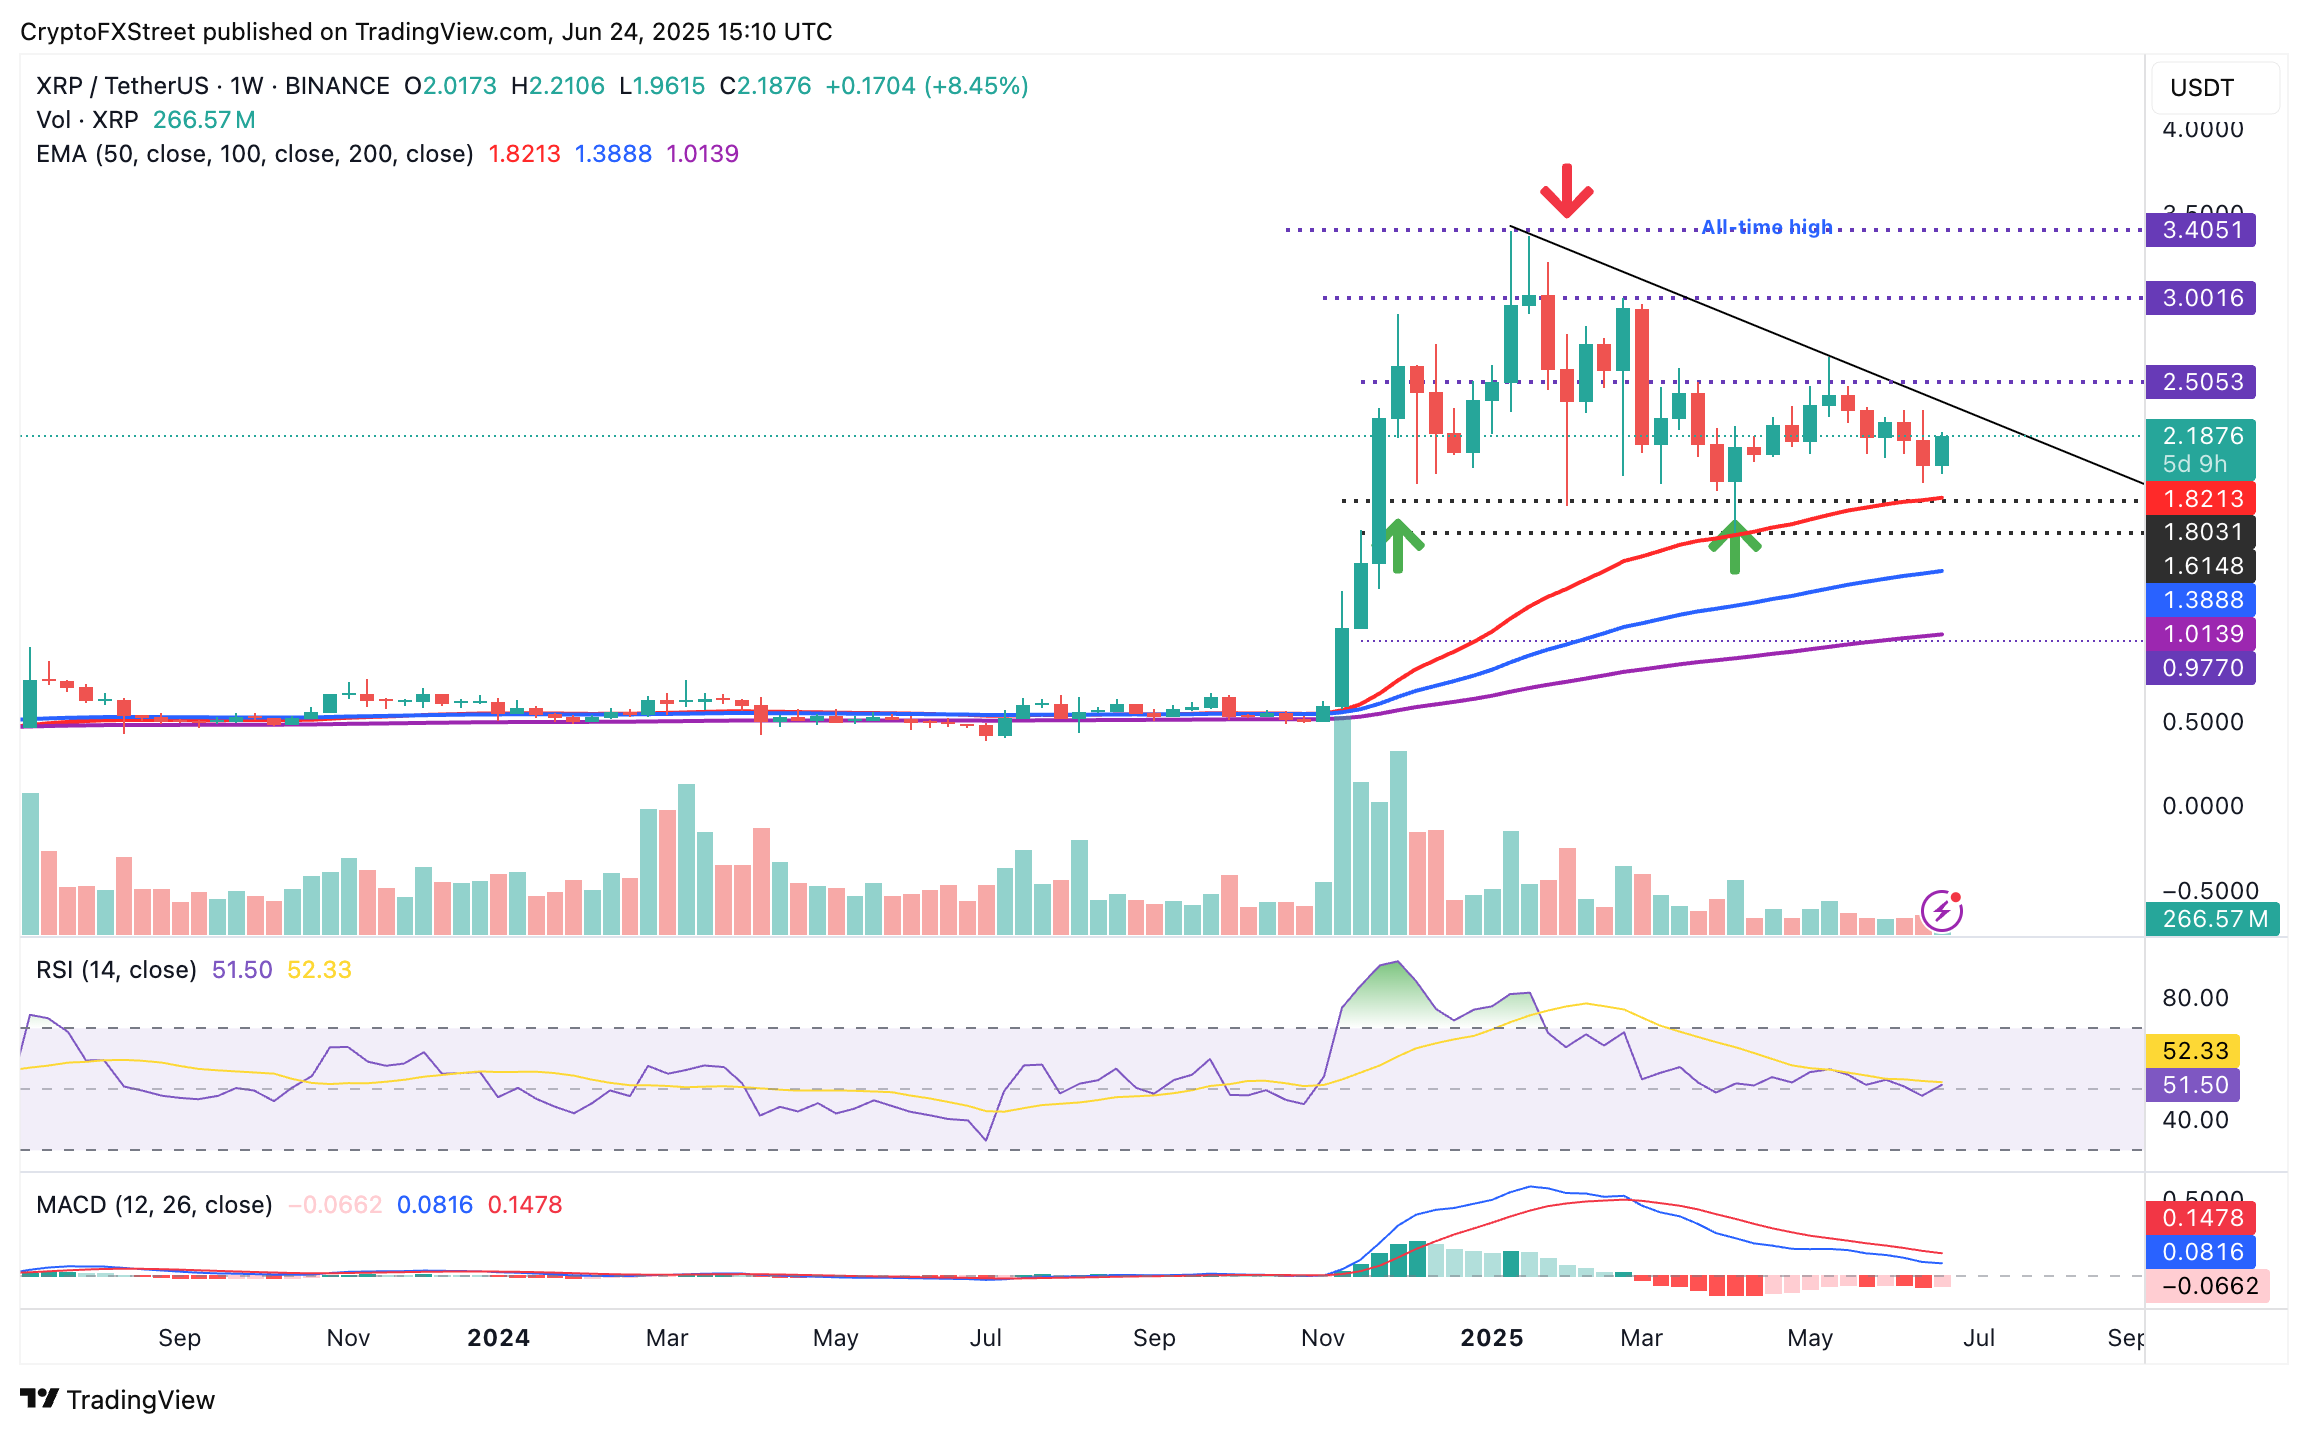
XRP/USDT weekly chart
However, the Moving Average Convergence Divergence (MACD) indicator has maintained a sell signal since early March when the blue MACD line flipped below the red signal line. This bearish outlook, combined with the red histogram bars extending below the zero line, encourages participants to reduce their exposure to XRP, which could cap the recovery as headwinds intensify.
Still, traders should pay attention to the MACD indicator, particularly for a buy signal. Such a signal would occur when the blue MACD line crosses above the red signal line, prompting traders to buy XRP and anticipate a larger price breakout.
Cryptocurrency metrics FAQs
The developer or creator of each cryptocurrency decides on the total number of tokens that can be minted or issued. Only a certain number of these assets can be minted by mining, staking or other mechanisms. This is defined by the algorithm of the underlying blockchain technology. On the other hand, circulating supply can also be decreased via actions such as burning tokens, or mistakenly sending assets to addresses of other incompatible blockchains.
Market capitalization is the result of multiplying the circulating supply of a certain asset by the asset’s current market value.
Trading volume refers to the total number of tokens for a specific asset that has been transacted or exchanged between buyers and sellers within set trading hours, for example, 24 hours. It is used to gauge market sentiment, this metric combines all volumes on centralized exchanges and decentralized exchanges. Increasing trading volume often denotes the demand for a certain asset as more people are buying and selling the cryptocurrency.
Funding rates are a concept designed to encourage traders to take positions and ensure perpetual contract prices match spot markets. It defines a mechanism by exchanges to ensure that future prices and index prices periodic payments regularly converge. When the funding rate is positive, the price of the perpetual contract is higher than the mark price. This means traders who are bullish and have opened long positions pay traders who are in short positions. On the other hand, a negative funding rate means perpetual prices are below the mark price, and hence traders with short positions pay traders who have opened long positions.
Author

John Isige
FXStreet
John Isige is a seasoned cryptocurrency journalist and markets analyst committed to delivering high-quality, actionable insights tailored to traders, investors, and crypto enthusiasts. He enjoys deep dives into emerging Web3 tren


