XRP derivatives show signs stability on Monday
- XRP increases for three consecutive days, trading above $2.50 on Monday.
- XRP futures funding rate stabilizes as bulls strive to regain control of the trend.
- XRP futures Open Interest remains suppressed at approximately $4 billion, indicating a lack of trader confidence in the recovery.

Ripple (XRP) regains momentum, trading above $2.50 on Monday as cryptocurrencies generally edge higher, offering relief to investors in the wake of last week's aggressive sell-off event.
XRP derivatives market metrics steady
The sell-off on Friday can be attributed to several factors, including macroeconomic tensions, uncertainty over the United States (US) government shutdown, and a lack of conviction in the crypto market's ability to sustain a bullish outlook throughout October.
US President Donald Trump's comments on the trade situation with China on Friday spooked investors, resulting in a violent sell-off across markets, including equities and crypto.
President Trump mulled additional tariffs on China, citing Beijing's planned restrictions on the export of rare earth metals and other export controls, casting doubts on the existing trade truce between the two economic giants.
The flash crash caught traders unawares, with many counting losses amid massive liquidations. CoinGlass data shows that the XRP futures Open Interest (OI)-weighted funding rate collapsed, reaching -0.2045% from 0.0081% on Thursday. In other words, sentiment turned extremely negative, as investors increasingly piled into short positions. Although the OI-weighted funding rate is now averaging -0.0005%, it remains significantly suppressed, which could keep prices subdued longer than expected.
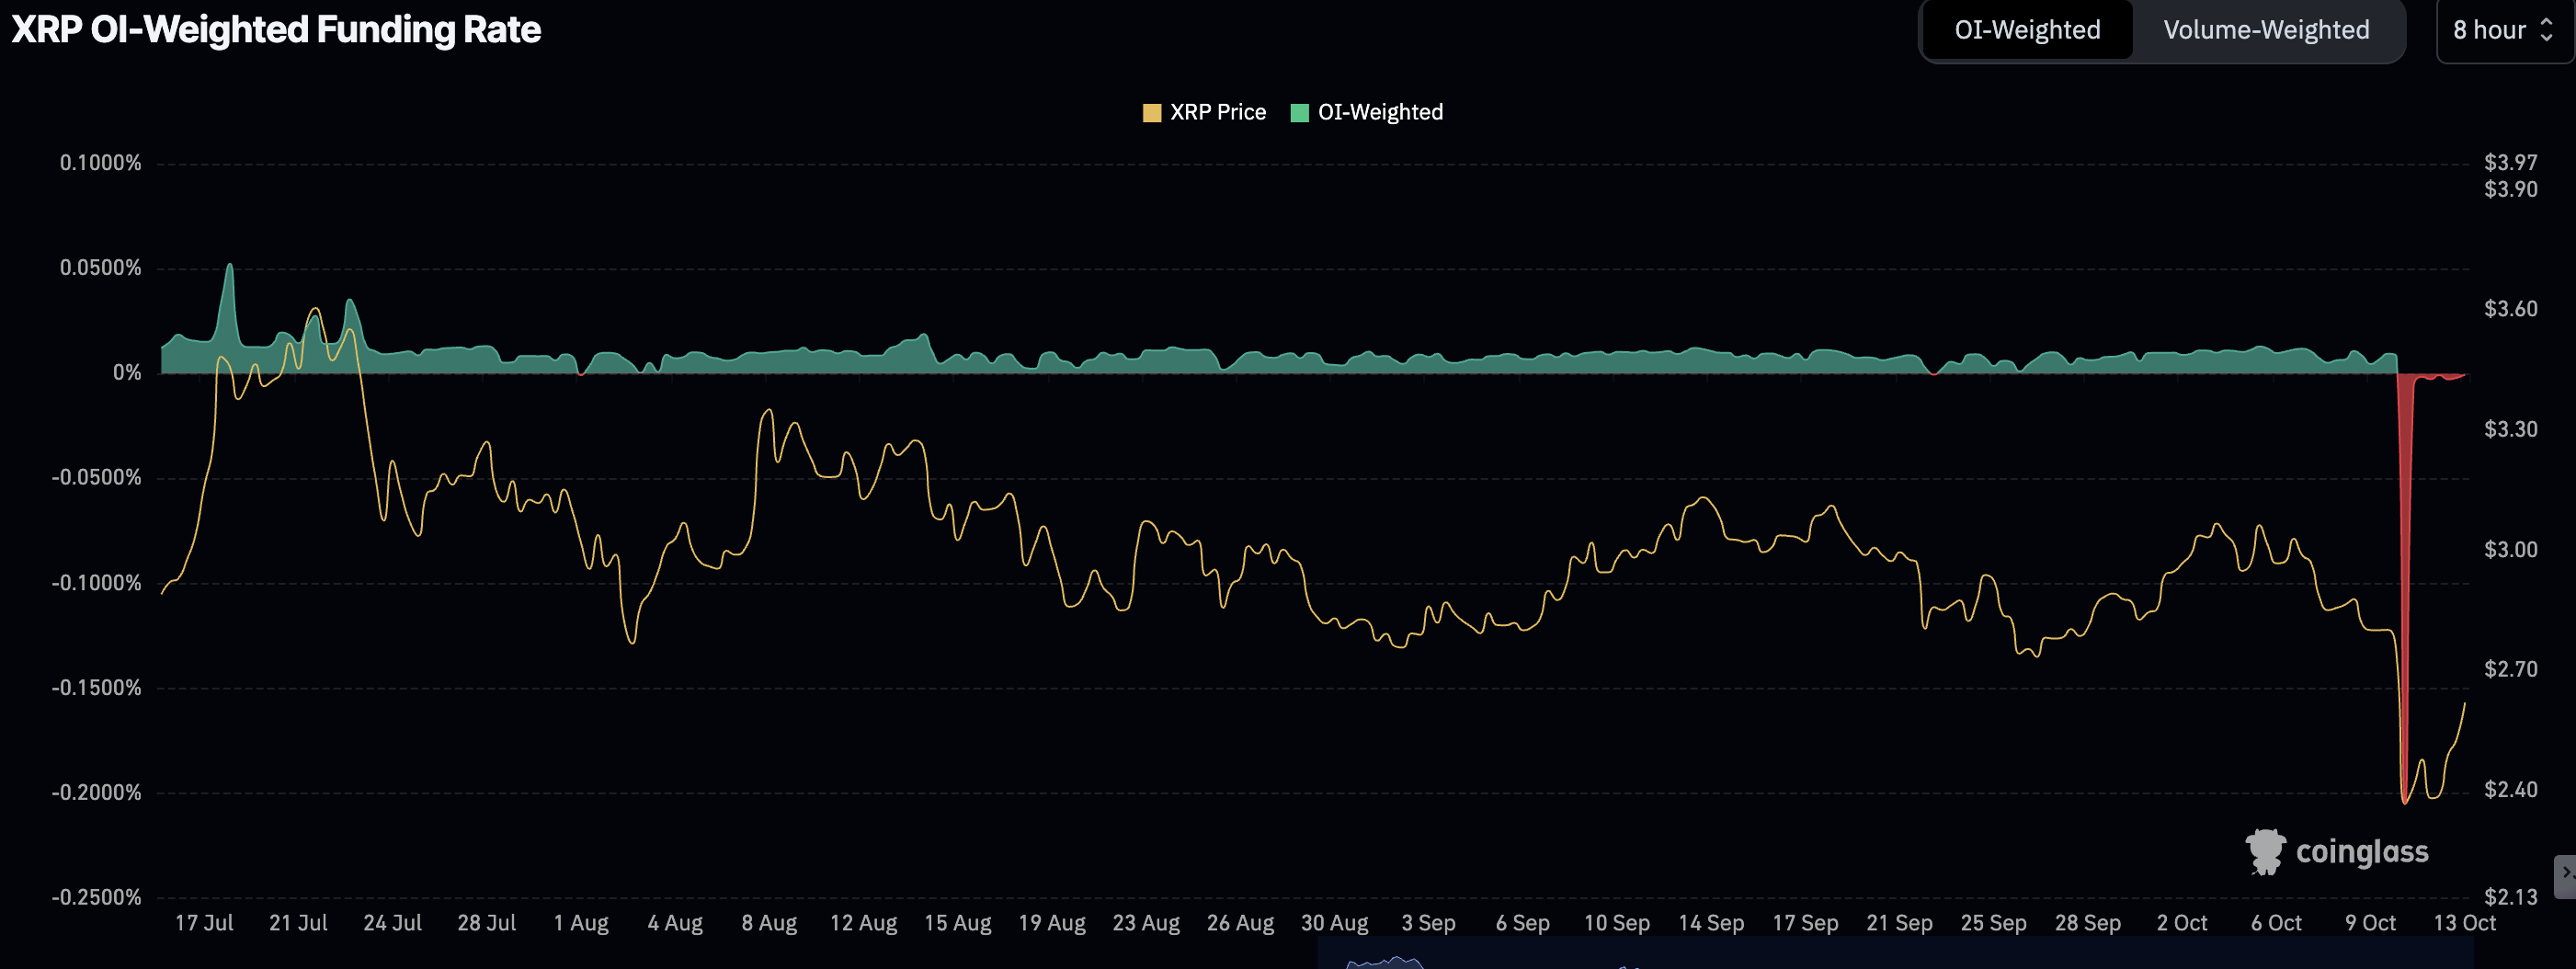
XRP Futures OI-Weighted Funding Rate | Source: CoinGlass
The futures OI, which refers to the notional value of outstanding futures contracts, also crashed to approximately $4 billion from $8.36 billion on Thursday. Declining OI indicates that traders lack conviction in XRP's ability to sustain recovery, with many investors remaining on the sidelines. Monitoring the direction that the futures OI may take could help investors trade XRP profitably despite the prevailing uncertainty.
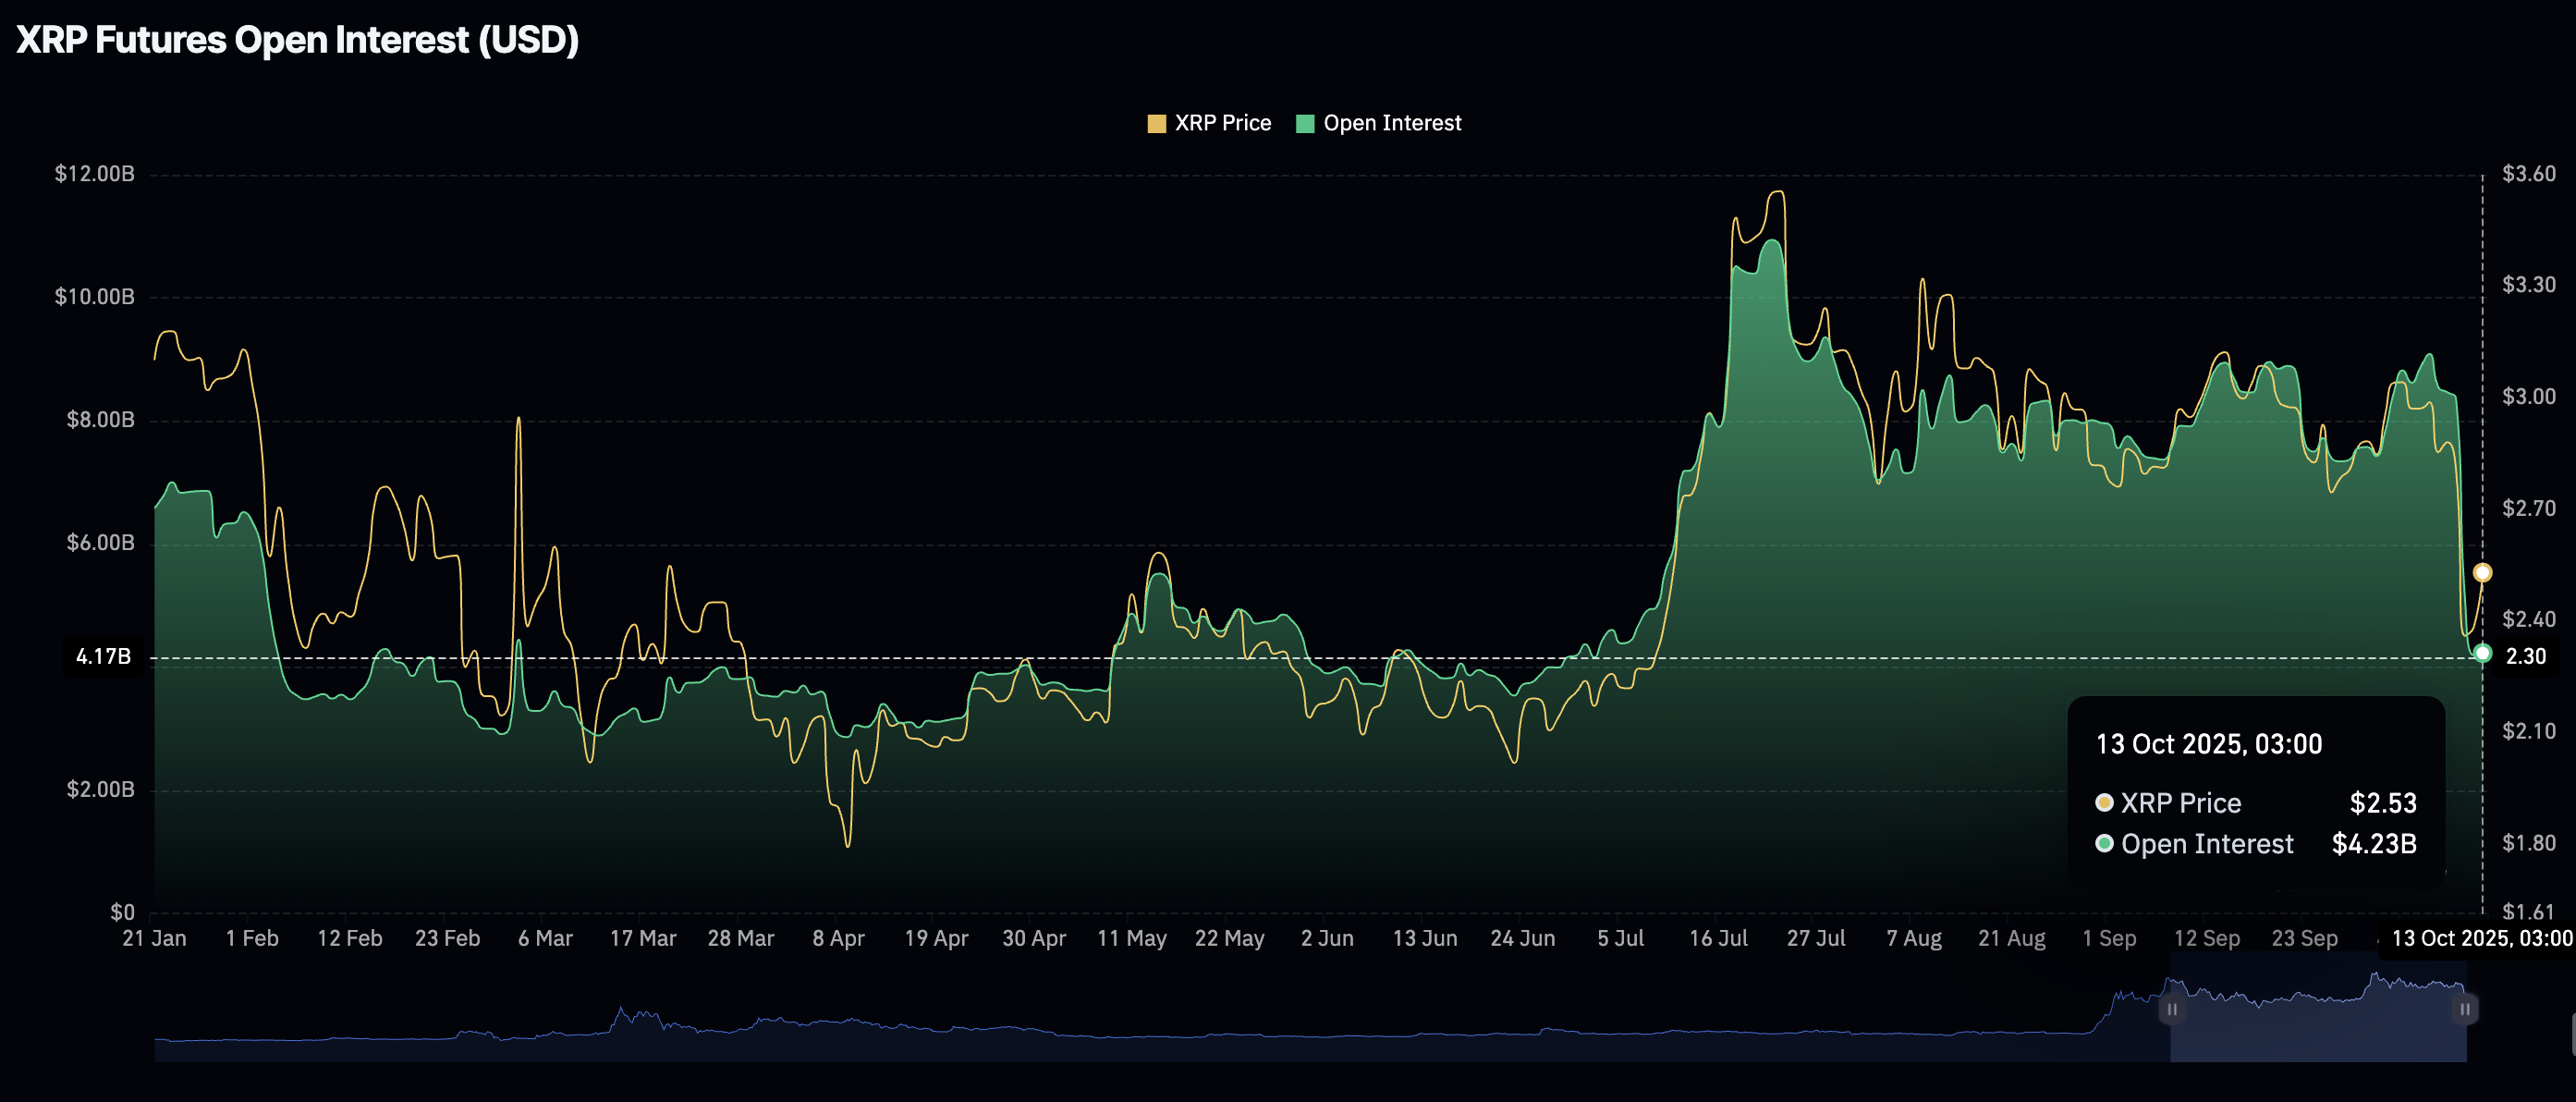
XRP Futures Open Interest | Source: CoinGlass
Technical outlook: Can XRP uphold recovery
XRP is trading above the key $2.50 level but remains capped under the 200-day Exponential Moving Average (EMA) at $2.63 on the daily chart. The Relative Strength Index (RSI), currently at 38, has recovered from the oversold region, indicating that bearish momentum is easing.
A daily close above the 200-day EMA would go a long way in validating the bullish grip. Other key milestones for XRP include reclaiming its position above the 100-day EMA at $2.82 and the 50-day EMA at $2.85.
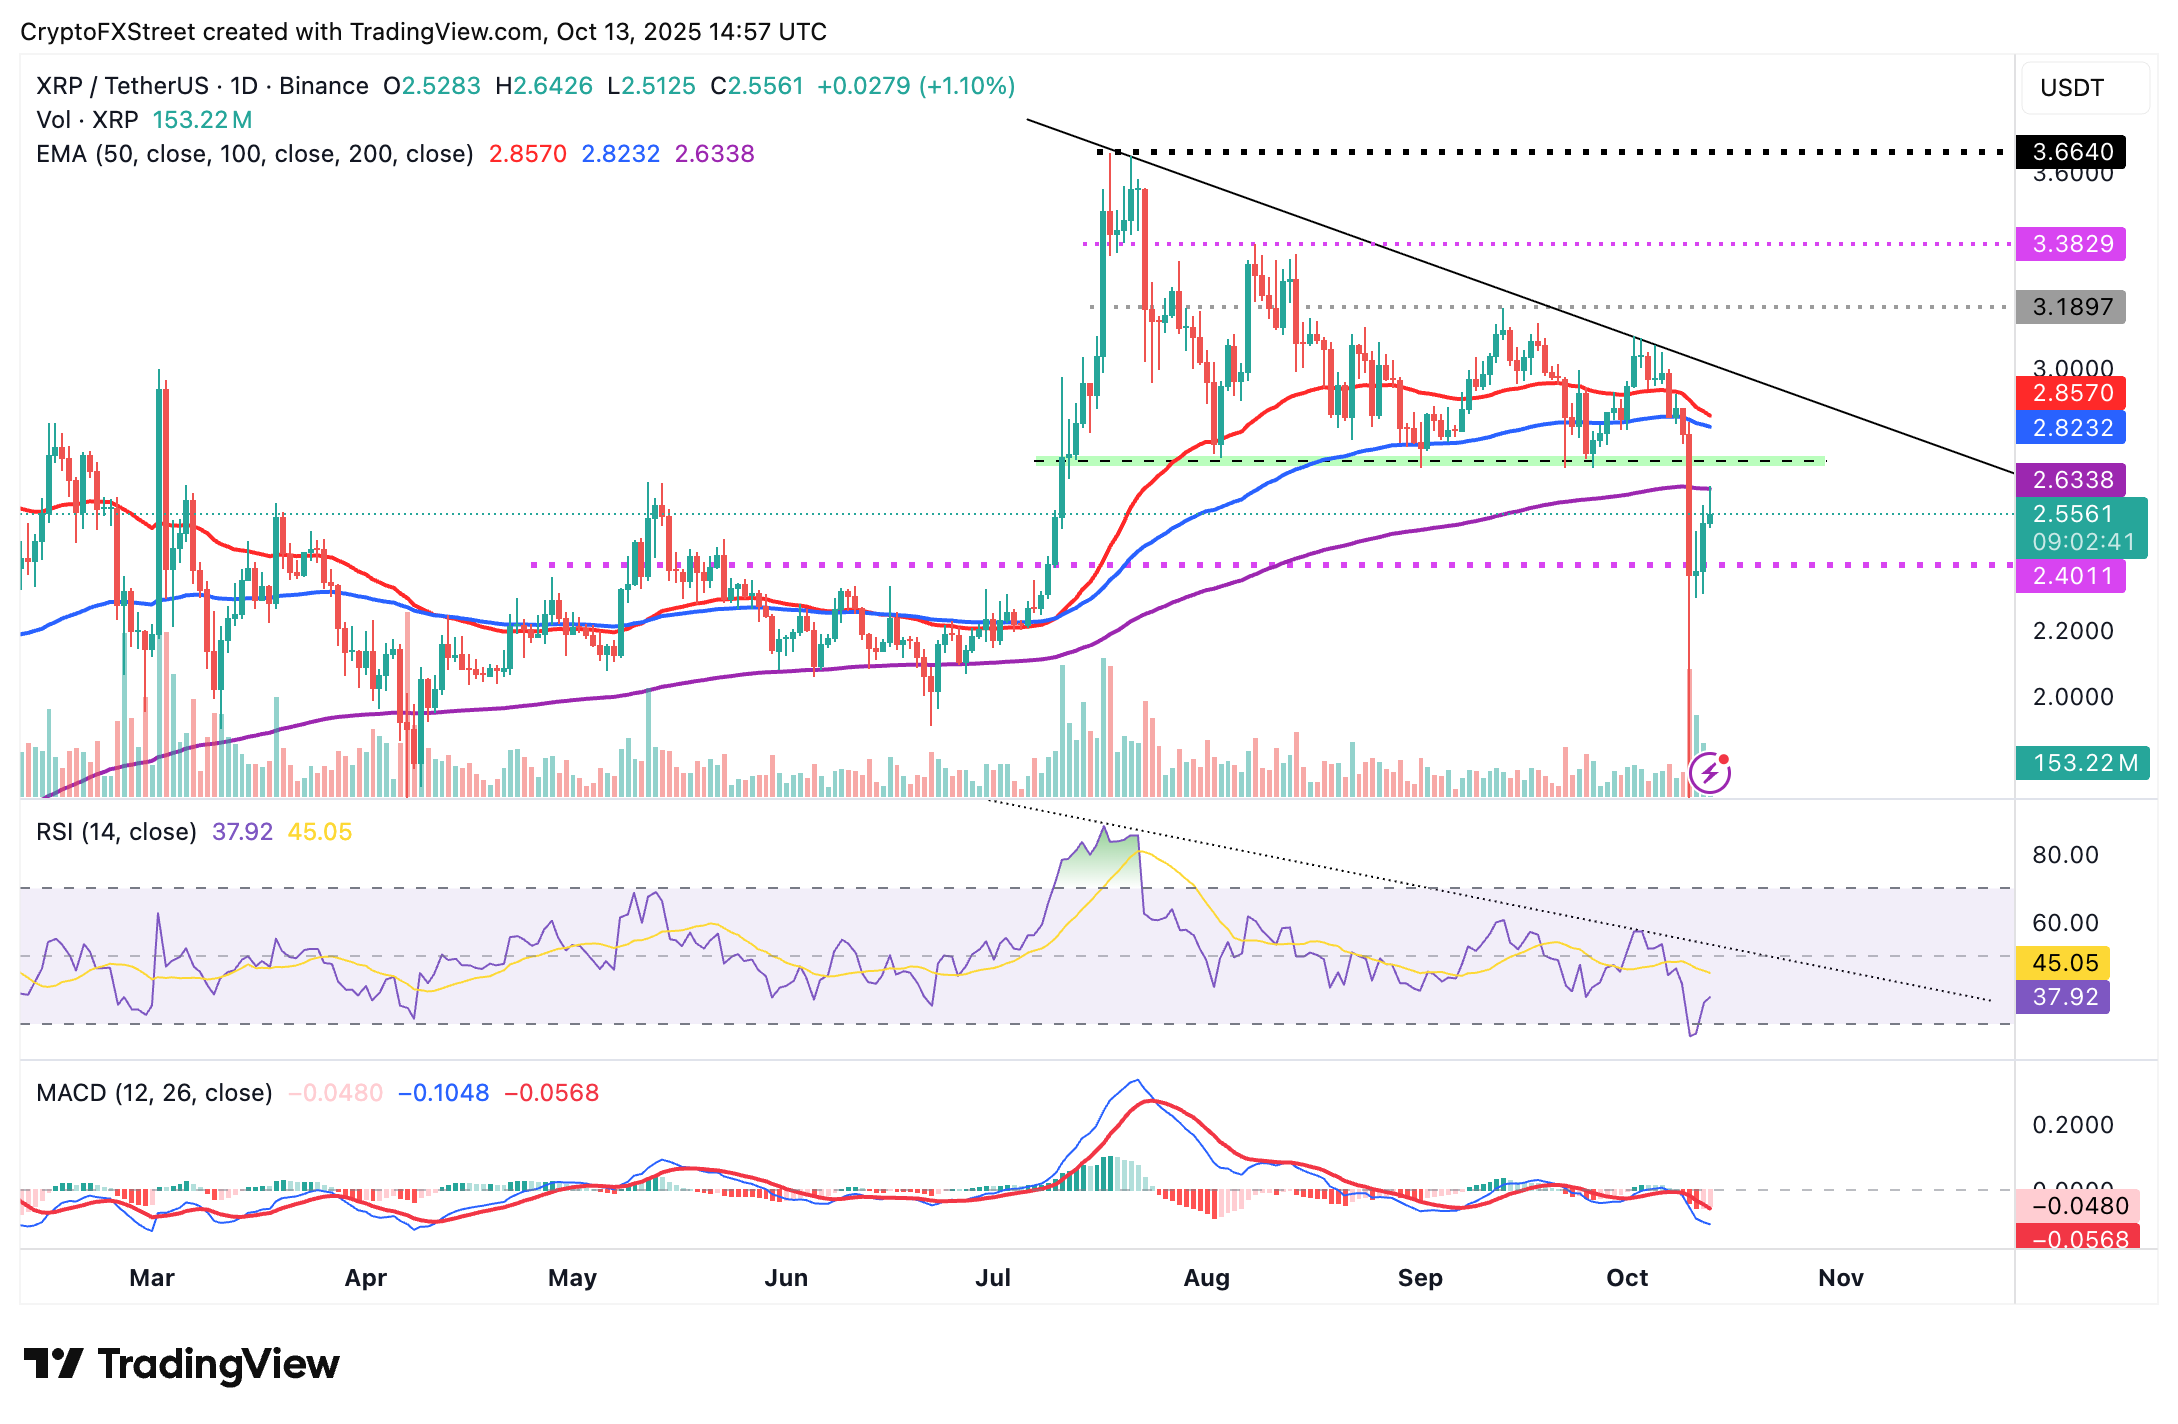
XRP/USDT daily chart
Still, traders should be cautiously optimistic, as bearish sentiment in the broader cryptocurrency market could remain sticky. Furthermore, the Moving Average Convergence Divergence (MACD) indicator upholds a sell signal, triggered on Thursday. If the blue line remains below the red signal line, investors may be inclined to reduce exposure, contributing to selling pressure.
Open Interest, funding rate FAQs
Higher Open Interest is associated with higher liquidity and new capital inflow to the market. This is considered the equivalent of increase in efficiency and the ongoing trend continues. When Open Interest decreases, it is considered a sign of liquidation in the market, investors are leaving and the overall demand for an asset is on a decline, fueling a bearish sentiment among investors.
Funding fees bridge the difference between spot prices and prices of futures contracts of an asset by increasing liquidation risks faced by traders. A consistently high and positive funding rate implies there is a bullish sentiment among market participants and there is an expectation of a price hike. A consistently negative funding rate for an asset implies a bearish sentiment, indicating that traders expect the cryptocurrency’s price to fall and a bearish trend reversal is likely to occur.
Author

John Isige
FXStreet
John Isige is a seasoned cryptocurrency journalist and markets analyst committed to delivering high-quality, actionable insights tailored to traders, investors, and crypto enthusiasts. He enjoys deep dives into emerging Web3 tren




