Ripple Price Prediction: XRP price recovery at risk as active addresses plunge
- XRP recovery loses momentum under the $2.24 supply zone, reflecting aggressive downside risks and geopolitical uncertainty.
- The XRP Ledger network activity suffers a significant decline as active addresses drop sharply to 100,000.
- XRP futures Open Interest rises slightly to $4 billion but remains in an overall downtrend from the mid-May peak of $5.52 billion.

Ripple (XRP) remains highly vulnerable to downside risks as the broader cryptocurrency market generally consolidates. The downturn from XRP’s recent peak of $2.34 coincides with a sharp decline in the network’s activity, particularly in the number of active addresses, which plummeted 84% to 100,000 in under three days.
Meanwhile, global markets remain on the edge amid geopolitical tensions in the Middle East, particularly the conflict between Israel and Iran.
XRP shows resilience amid slump in network activity
The downside risks preventing the XRP price from extending the uptrend remain largely limited between the key support level around $2.09 and the resistance at $2.34. In addition to the geopolitical tensions between Israel and Iran, which are marked by a delicate conflict, the lethargic price action can be attributed to declining network activity on the XRP Ledger (XRPL).
Santiment shows that after active addresses monitored on a 24-hour basis exploded on Saturday, reaching 609,000, a sharp drop followed, resulting in an 84% decline to 100,000 as observed on Tuesday.
 [15-1750169823466.07.05, 17 Jun, 2025].png)
XRP Ledger Active Addresses metric | Source: Santiment
Network activity metrics track the performance of the XRP Ledger in terms of active addresses interacting with the protocol, either by sending or receiving XRP. The sharp slump witnessed over the last three days indicates a decline in interest in the cross-border money transfer token, effectively reducing demand.
If the downtrend sustains, reflecting the minimal activity experienced between early April and June, it could be challenging for the price of XRP to stabilize the uptrend and aim for highs beyond $3.00.
Key fundamental indicators, such as the futures market Open Interest (OI), support the lack of conviction and interest in XRP. CoinGlass highlights a minor uptick in the OI to $4 billion, as illustrated in the chart below. However, the overall trend has remained downward since the surge to $5.52 billion around mid-May.
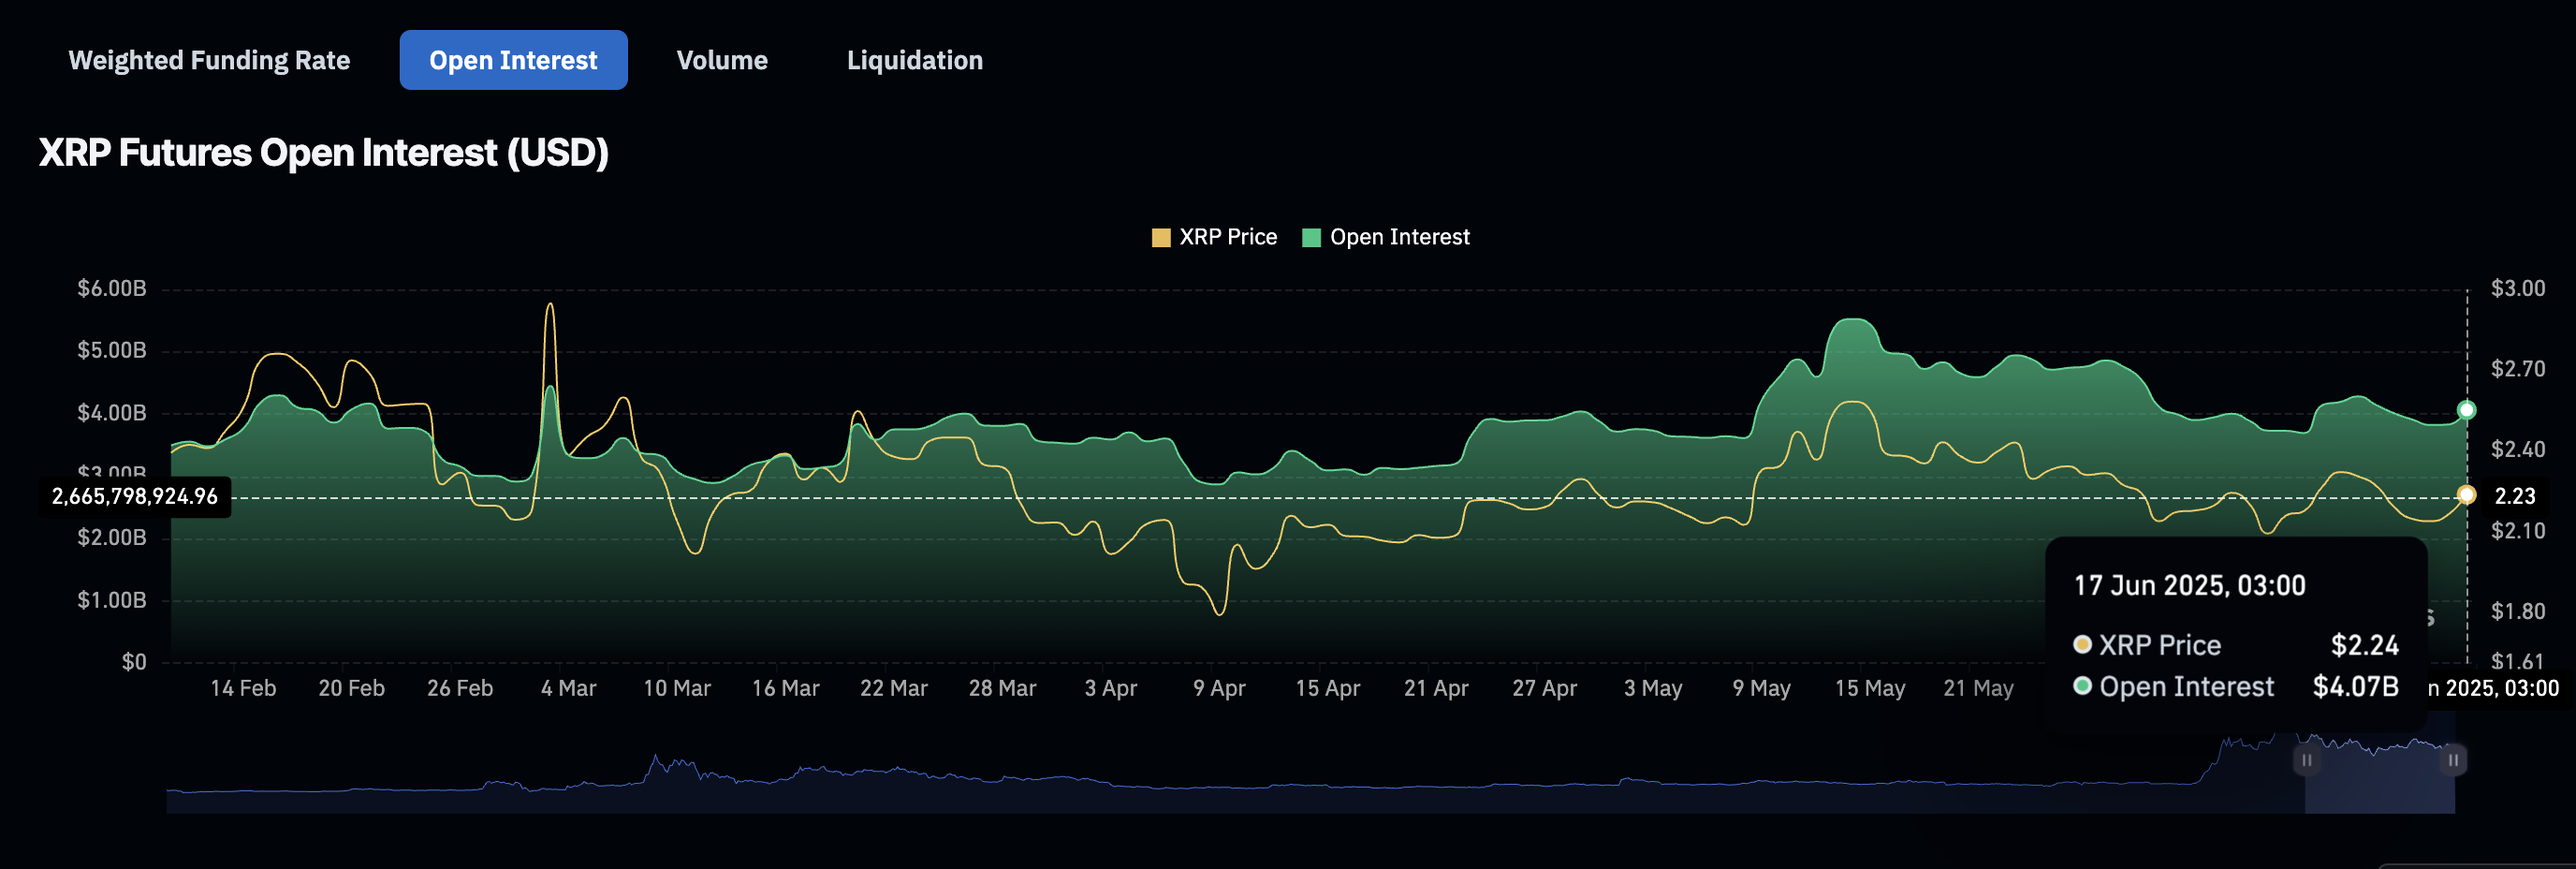
XRP futures OI | Source: CoinGlass
The persistent downtrend in OI, which refers to the value of active futures and options contracts that have yet to be settled or closed, coincides with a bearish bias, underpinned by long position liquidations of $4.21 million compared to shorts at $739,000 over the last 24 hours.
Meanwhile, the subsequent increase in derivatives market trading volume by over 200% to $9.8 billion points to an increase in demand for XRP as traders cover their positions amid growing uncertainty due to geopolitical tensions in the Middle East.
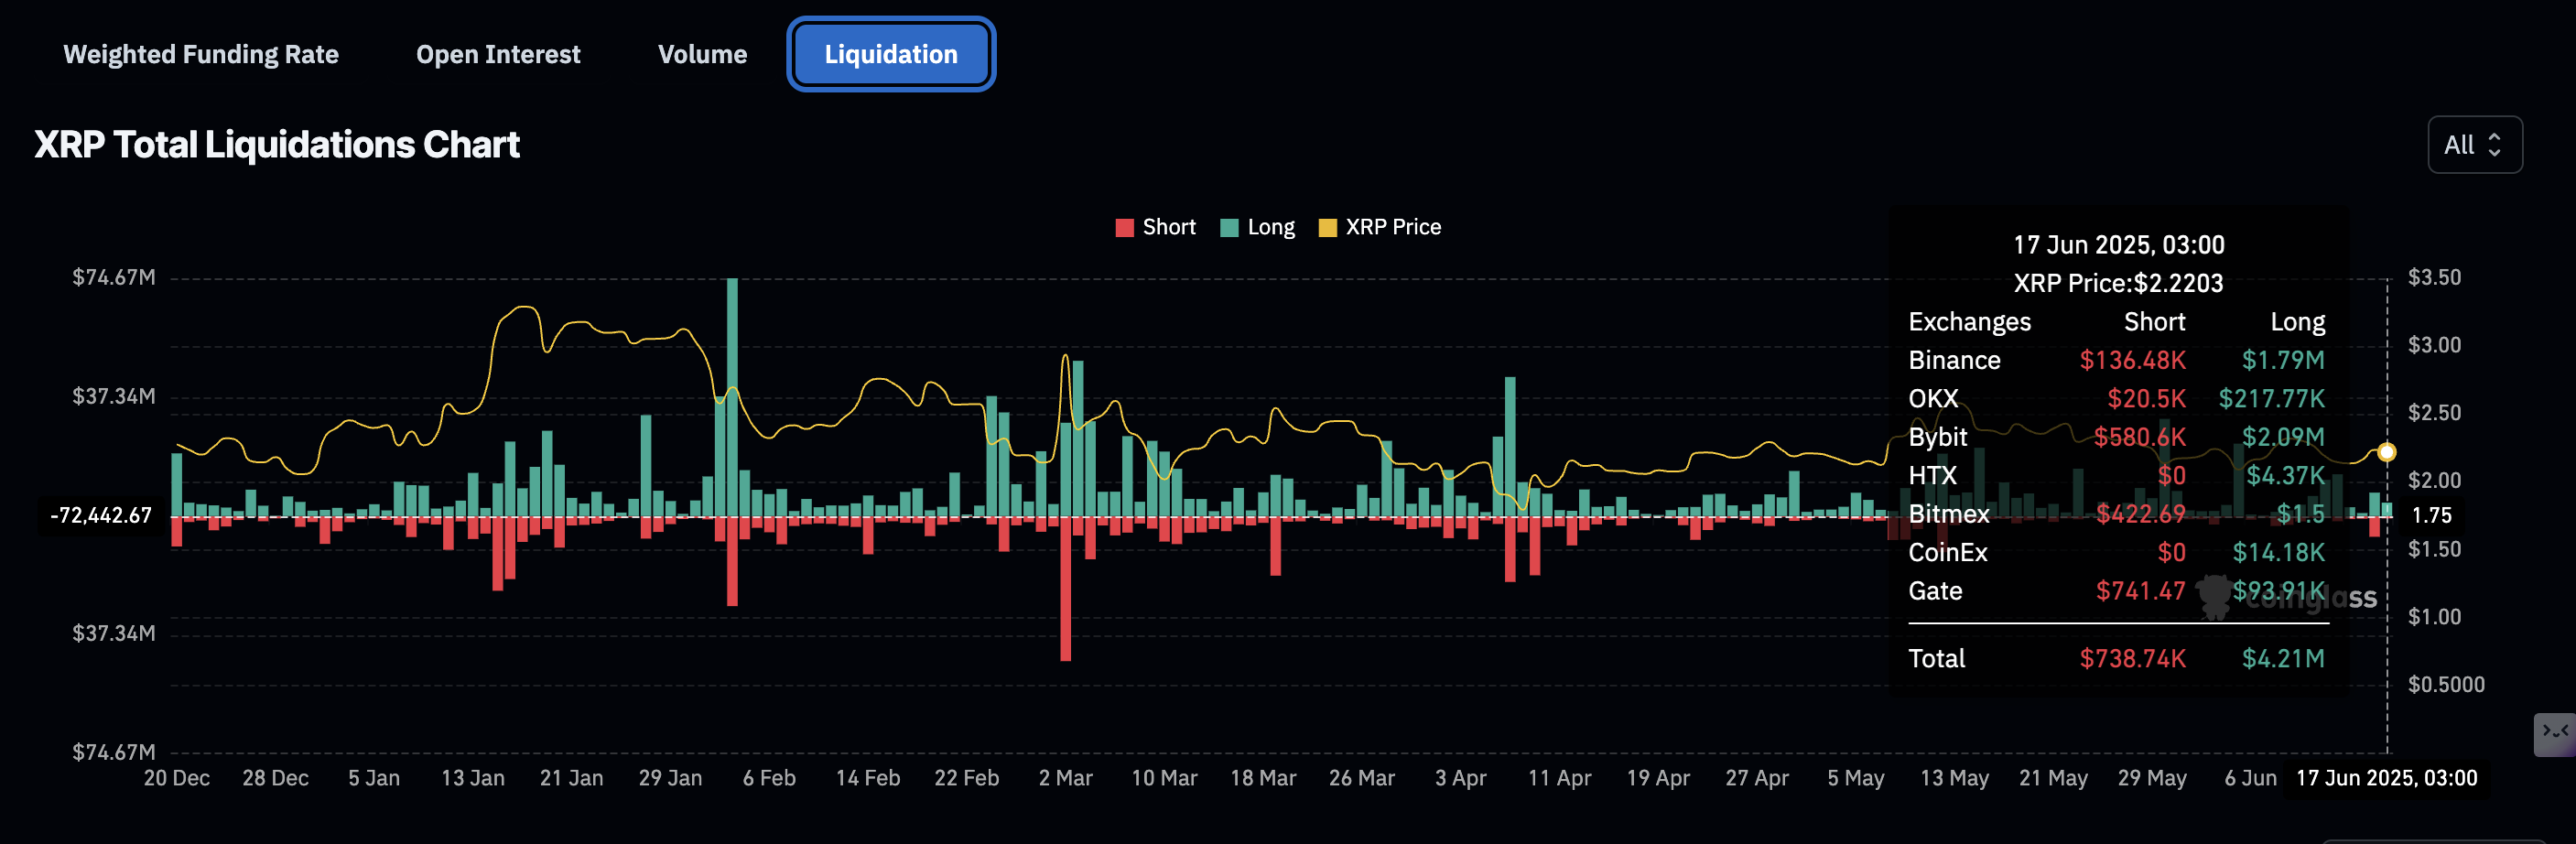
XRP futures liquidation chart | Source: CoinGlass
Similarly, price action is expected to remain relatively muted ahead of the Federal Reserve (Fed) meeting on Wednesday. The event “stands as this week’s focal macro event, with traders watching closely for the updated dot plot for clues on rate trajectories,” a K33 Research report states.
“While recent inflation data and geopolitical strife may encourage a dovish Fed outlook, potential fiscal expansion through a multi-trillion-dollar budget bill could nudge policymakers toward a more hawkish stance,” the report projects.
Technical outlook: XRP trending downward
XRP’s price generally slides within a descending channel, extending the decline from May’s peak of $2.65. An attempt to break free of the upper trendline resistance on Monday failed, highlighting the supply-rich confluence resistance at around $2.24. The 50-day Exponential Moving Average (EMA) and the 100-day EMA converge at this level, marking a robust hurdle.
A breach of this resistance could shift market dynamics for XRP, paving the way for a swing high targeting $2.65 and $3.00 levels.
The Relative Strength Index (RSI) continues to uphold bearish momentum, as it has been sloping downward below a descending trendline since mid-May. Bears could tighten their grip on XRP if the RSI extends toward the oversold region.
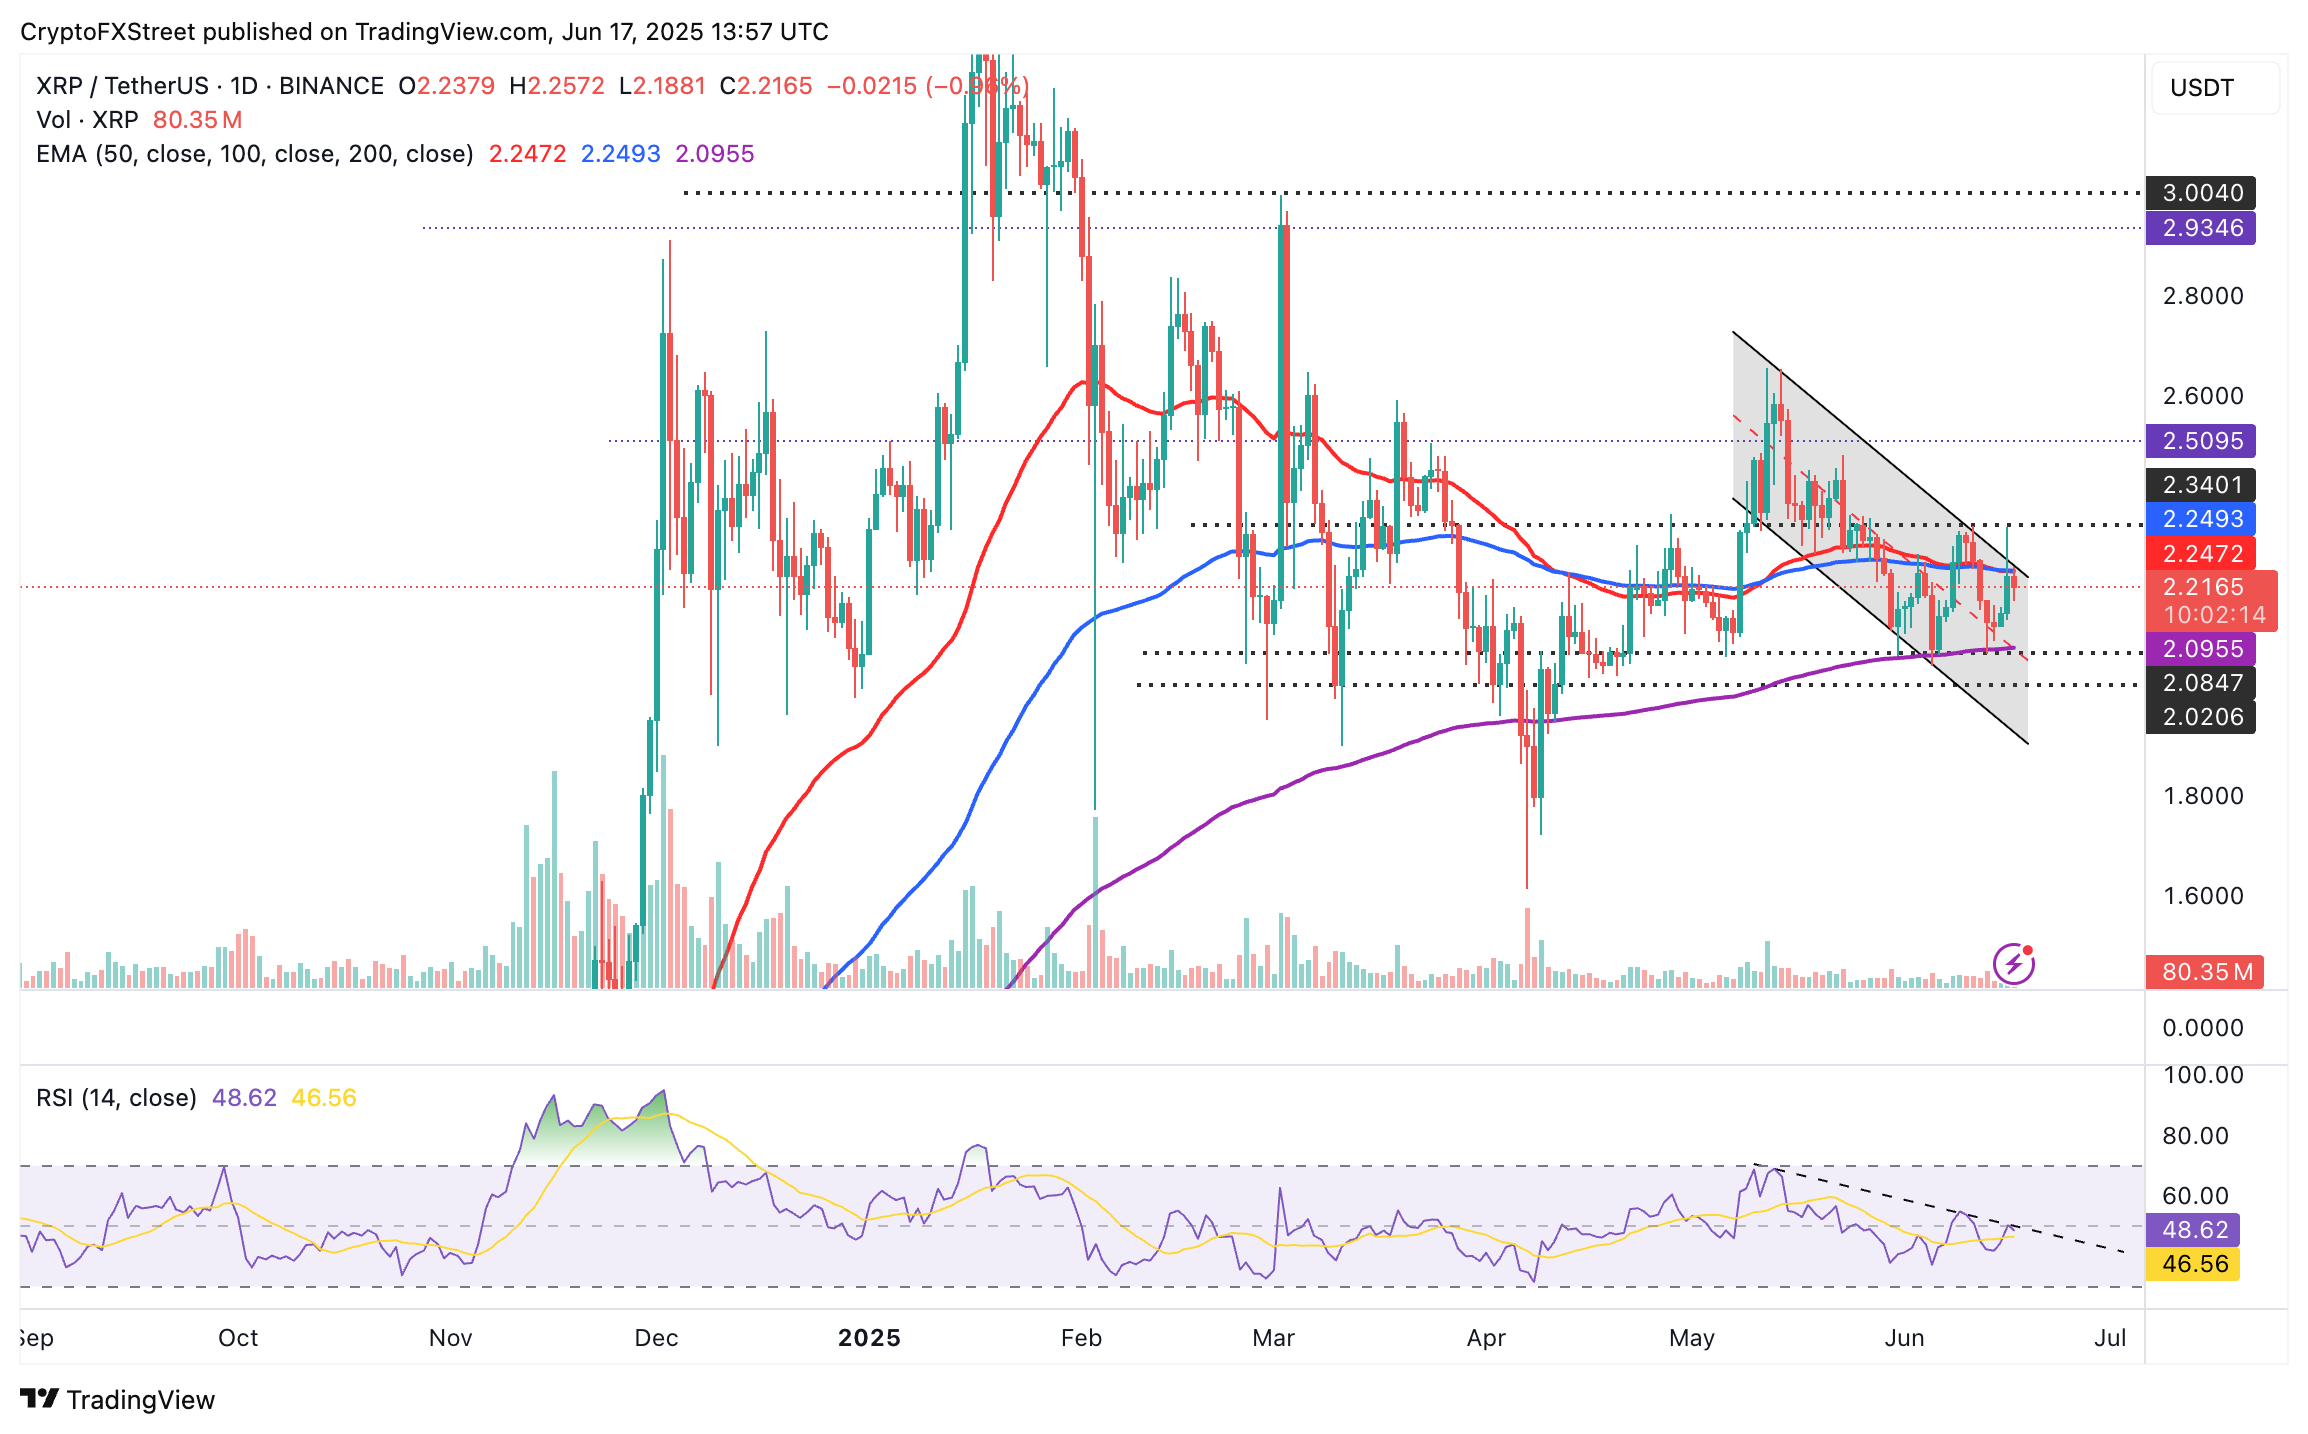
XRP/USDT daily chart
Key areas of interest include the 200-day EMA support at $2.09, which was tested on Friday, and the area around $2.00. Below these two levels, further losses could bring the April low of $1.61 reached during the tariff-triggered sell-off into sight.
Cryptocurrency metrics FAQs
The developer or creator of each cryptocurrency decides on the total number of tokens that can be minted or issued. Only a certain number of these assets can be minted by mining, staking or other mechanisms. This is defined by the algorithm of the underlying blockchain technology. On the other hand, circulating supply can also be decreased via actions such as burning tokens, or mistakenly sending assets to addresses of other incompatible blockchains.
Market capitalization is the result of multiplying the circulating supply of a certain asset by the asset’s current market value.
Trading volume refers to the total number of tokens for a specific asset that has been transacted or exchanged between buyers and sellers within set trading hours, for example, 24 hours. It is used to gauge market sentiment, this metric combines all volumes on centralized exchanges and decentralized exchanges. Increasing trading volume often denotes the demand for a certain asset as more people are buying and selling the cryptocurrency.
Funding rates are a concept designed to encourage traders to take positions and ensure perpetual contract prices match spot markets. It defines a mechanism by exchanges to ensure that future prices and index prices periodic payments regularly converge. When the funding rate is positive, the price of the perpetual contract is higher than the mark price. This means traders who are bullish and have opened long positions pay traders who are in short positions. On the other hand, a negative funding rate means perpetual prices are below the mark price, and hence traders with short positions pay traders who have opened long positions.
Author

John Isige
FXStreet
John Isige is a seasoned cryptocurrency journalist and markets analyst committed to delivering high-quality, actionable insights tailored to traders, investors, and crypto enthusiasts. He enjoys deep dives into emerging Web3 tren


