Ripple Price Forecast: XRP's NUPL, SOPR signal bullish breakout
- XRP is positioned above the 50-period EMA and the $3.00 short-term support level.
- The Spent Output Profit Ratio remains above 1, indicating XRP supply is still in profit, but investors are reluctant to sell.
- XRP’s Net Unrealized Profit/Loss grinds toward 0.50, signaling a potential local bottom.

Ripple (XRP) shows signs of recovery, holding support at $3.00 on Thursday. Interest in the cross-border money remittance token has steadied over the past few days, underpinned by the futures weighted funding rate rising to 0.0090% from 0.0018% recorded on Tuesday.
As traders increasingly leverage long positions in XRP, the growth in funding rate will continue to back positive market sentiment, increasing the probability of a short-term bullish breakout.
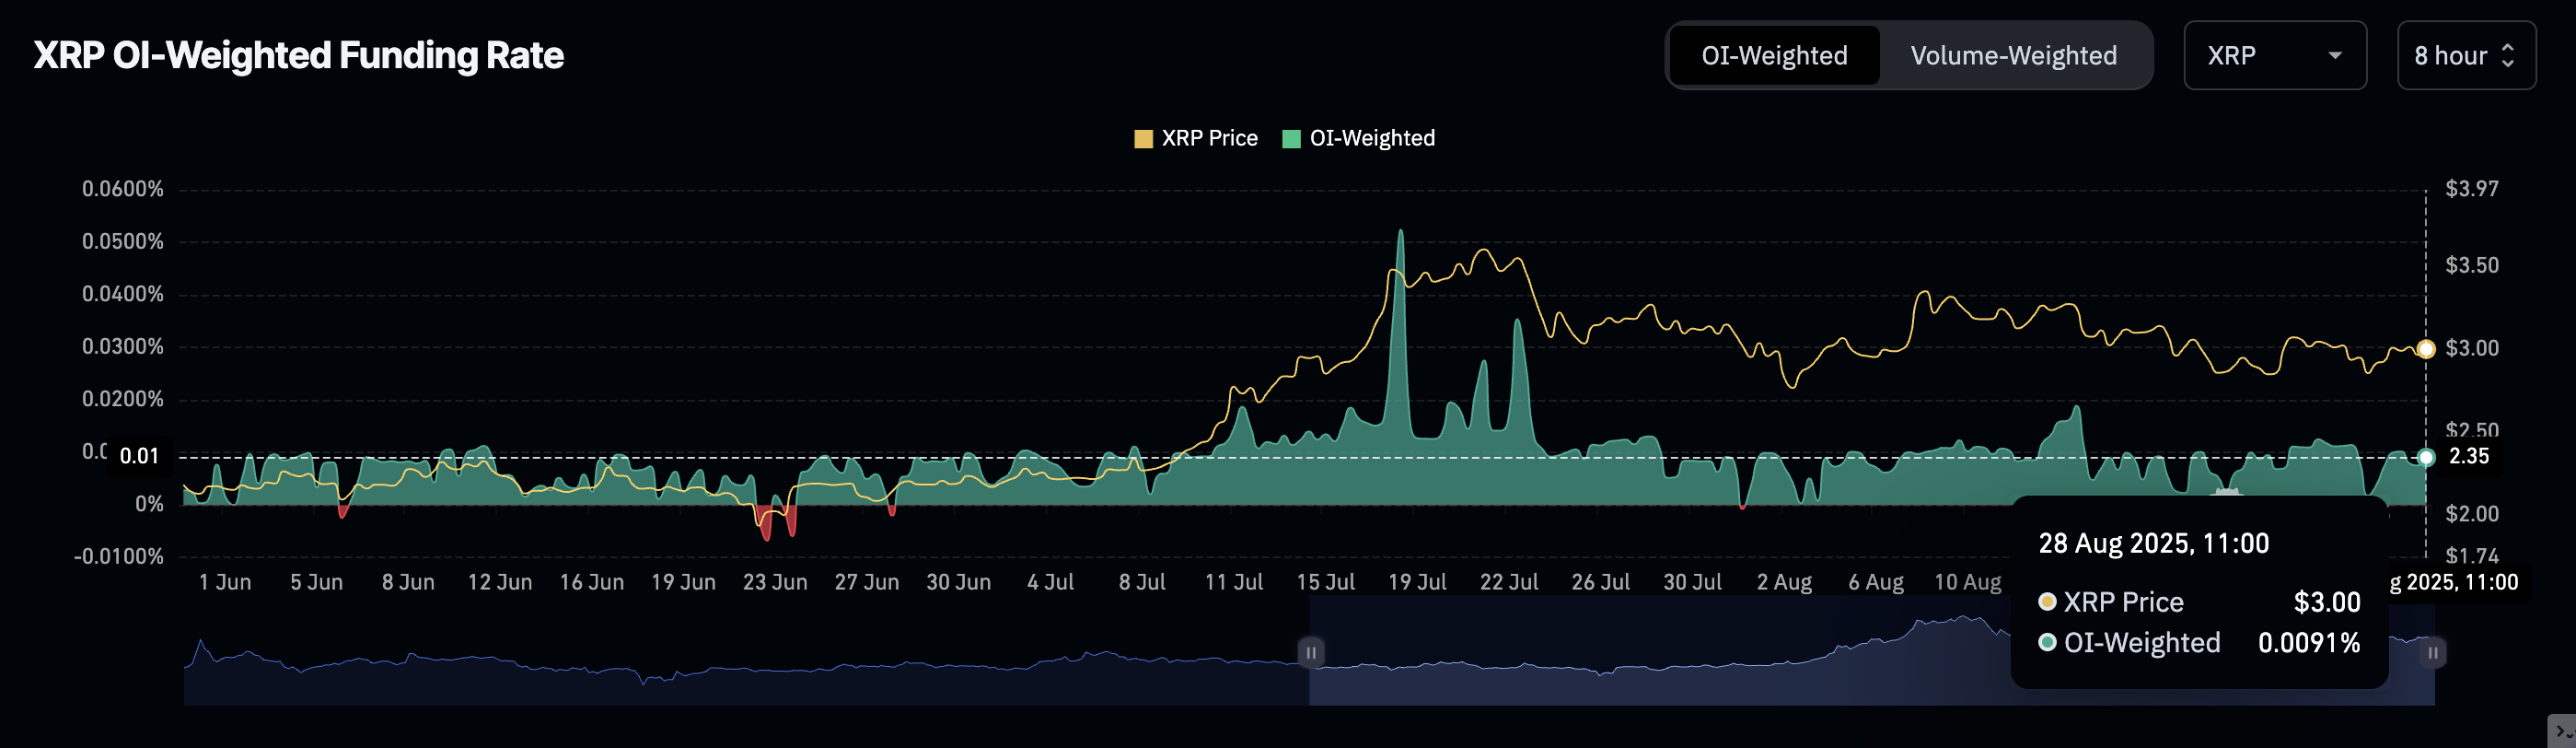
XRP Futures Weighted Funding Rate | Source: CoinGlass
XRP consolidates as on-chain metrics signal breakout
The XRP Spent Output Profit Ratio (SOPR) metric has, over the last few weeks, edged lower toward a ratio of 1, following rampant profit-taking after the price hit a new record high of $3.66 on July 18.
According to Glassnode, SOPR is “the realized value (USD) divided by the value at creation (USD) of the output.” Simply put, this metric highlights the value of the price sold divided by the price paid.
When the SOPR is above 1, it means that holders of the spent XRP tokens are in profit at the time of the transaction and in loss when the metric is less than 1.
Investors are often inclined to sell when in profit and would prefer to hold when the SOPR is below 1. Based on the current SOPR of 1.09, investors are reluctant to sell, possibly anticipating XRP price recovery above the $3.00 short-term support.
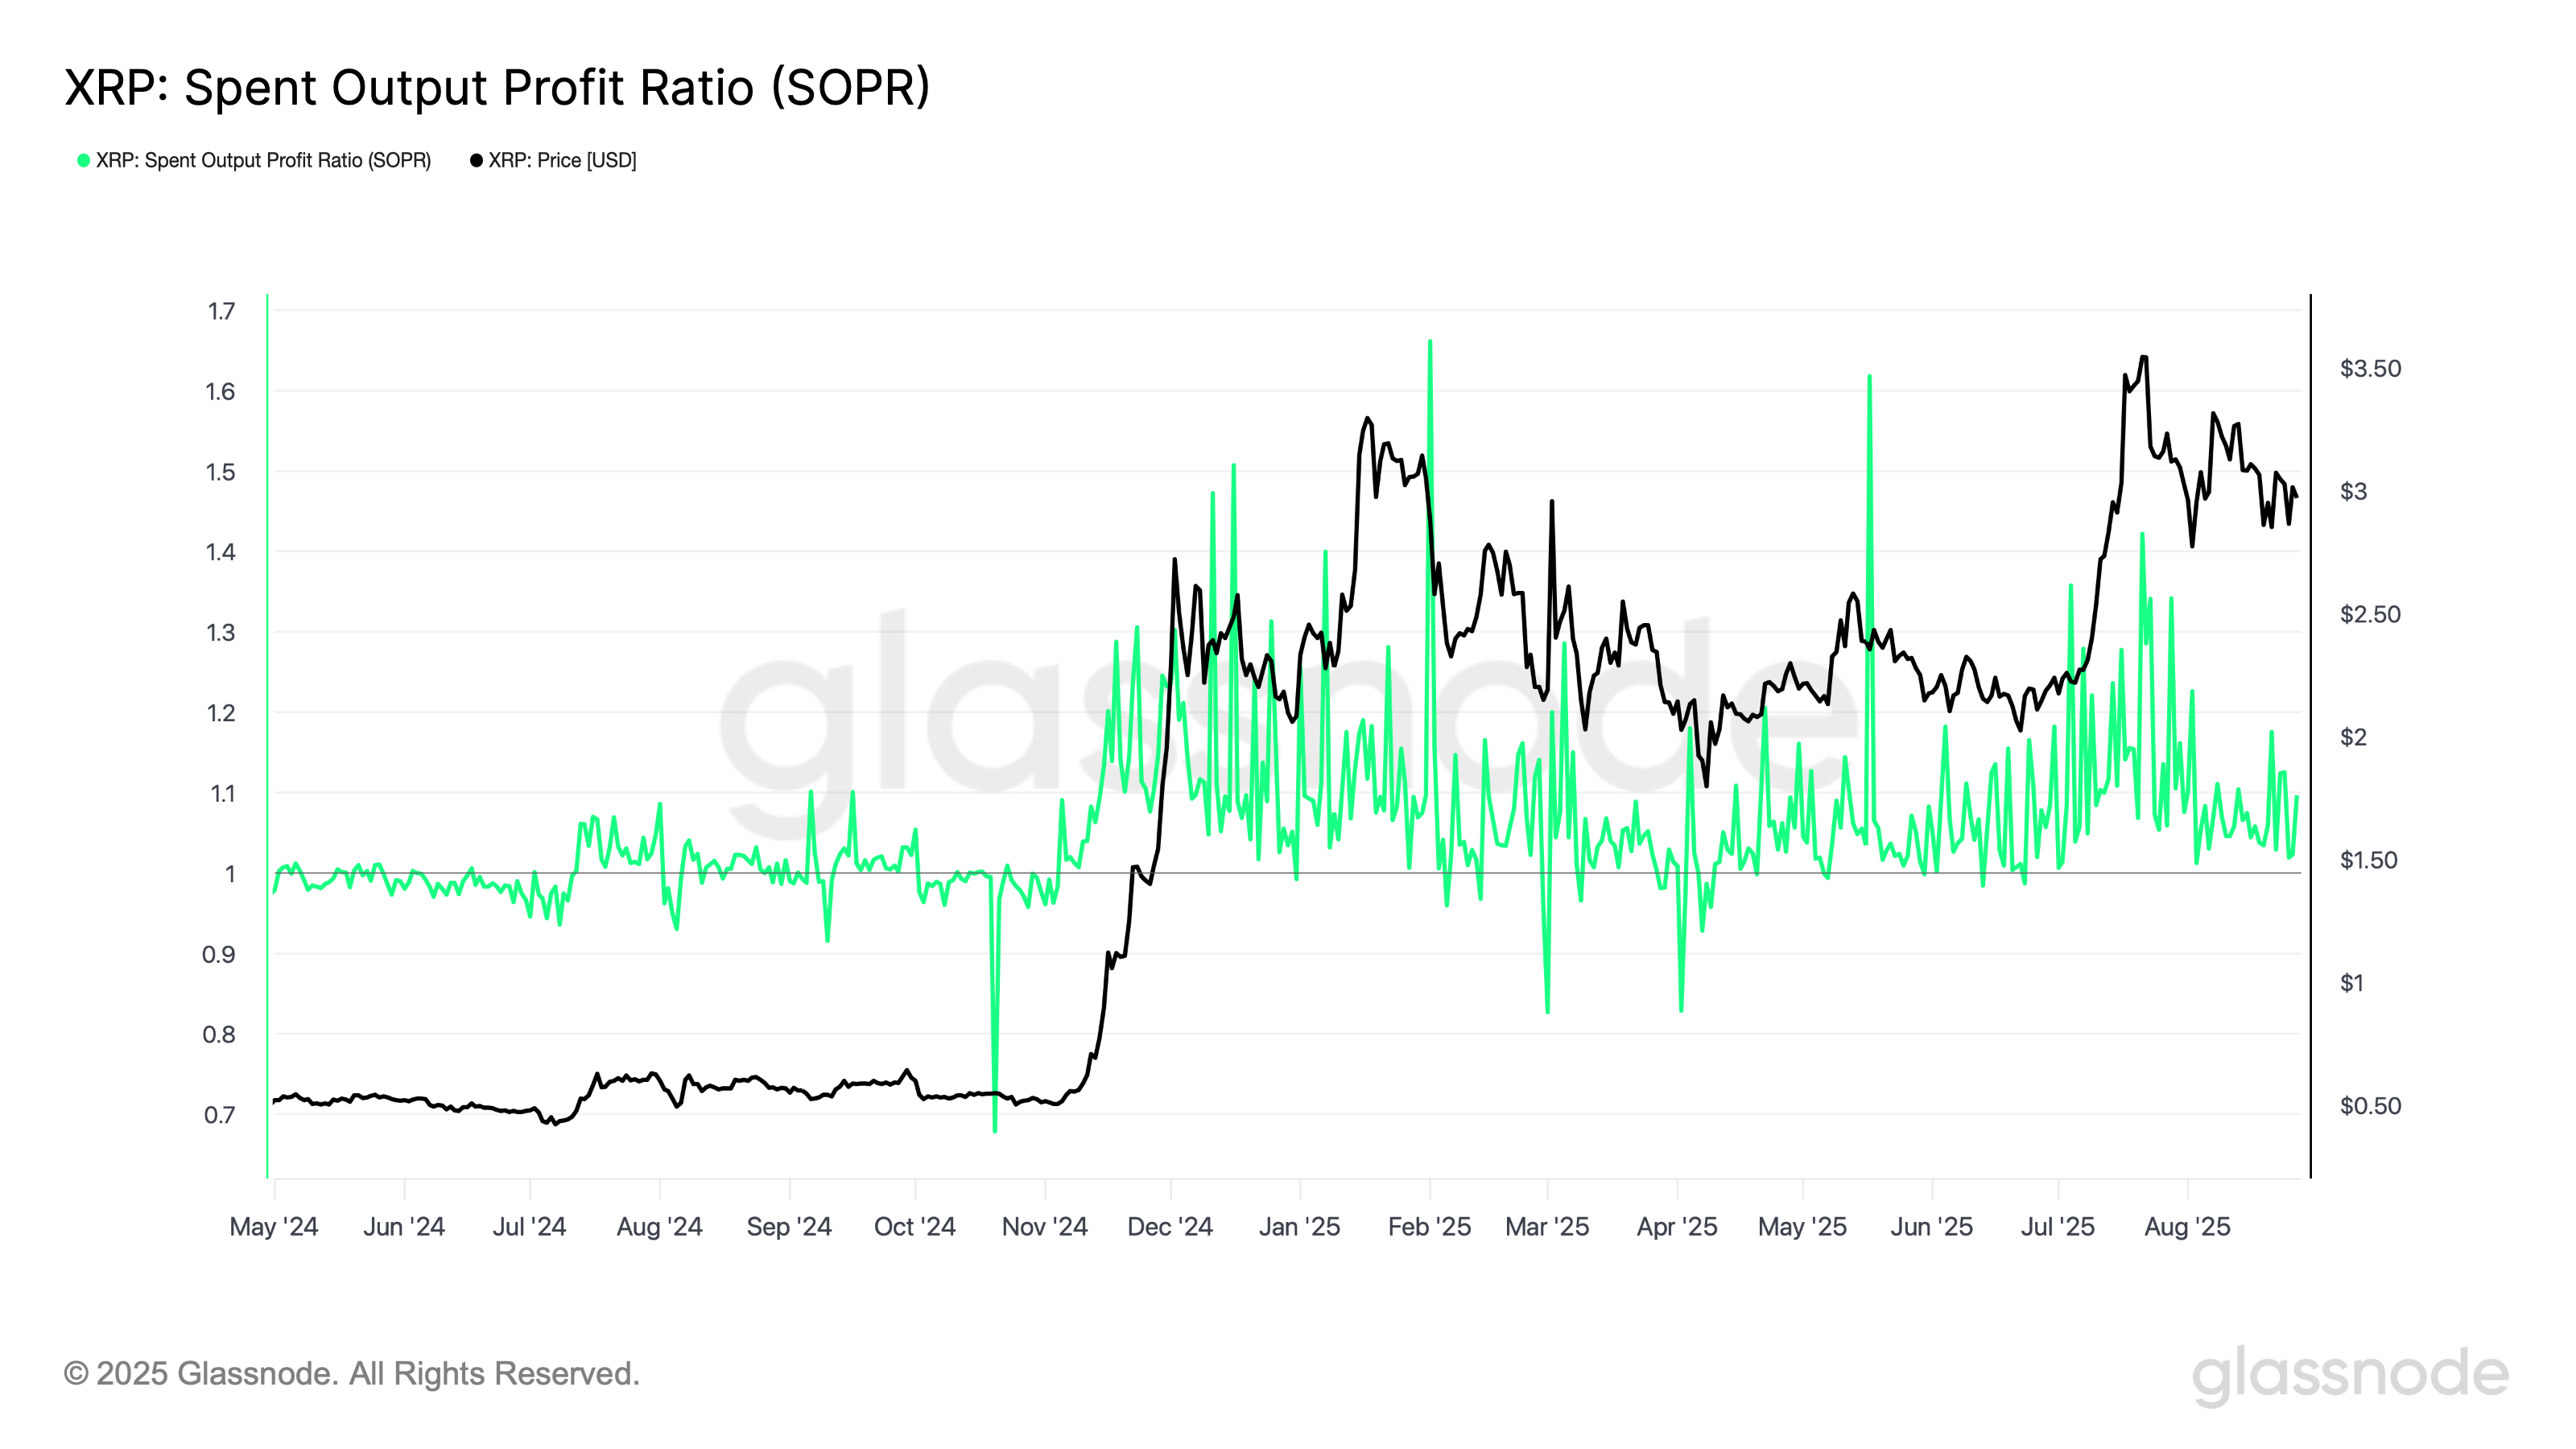
XRP SOPR metric | Source: Glassnode
Similarly, the Net Unrealized Profit/Loss (NUPL) stands at 0.54 and is grinding toward the critical 0.50 level. NUPL is the supply of XRP that is in profit or loss at any given time and to what extent.
An NUPL reading near 0.5 indicates a potential local bottom within the cycle. Investors will likely take advantage of the cooling in the XRP price from its all-time high to increase exposure, anticipating a short-term bullish breakout.
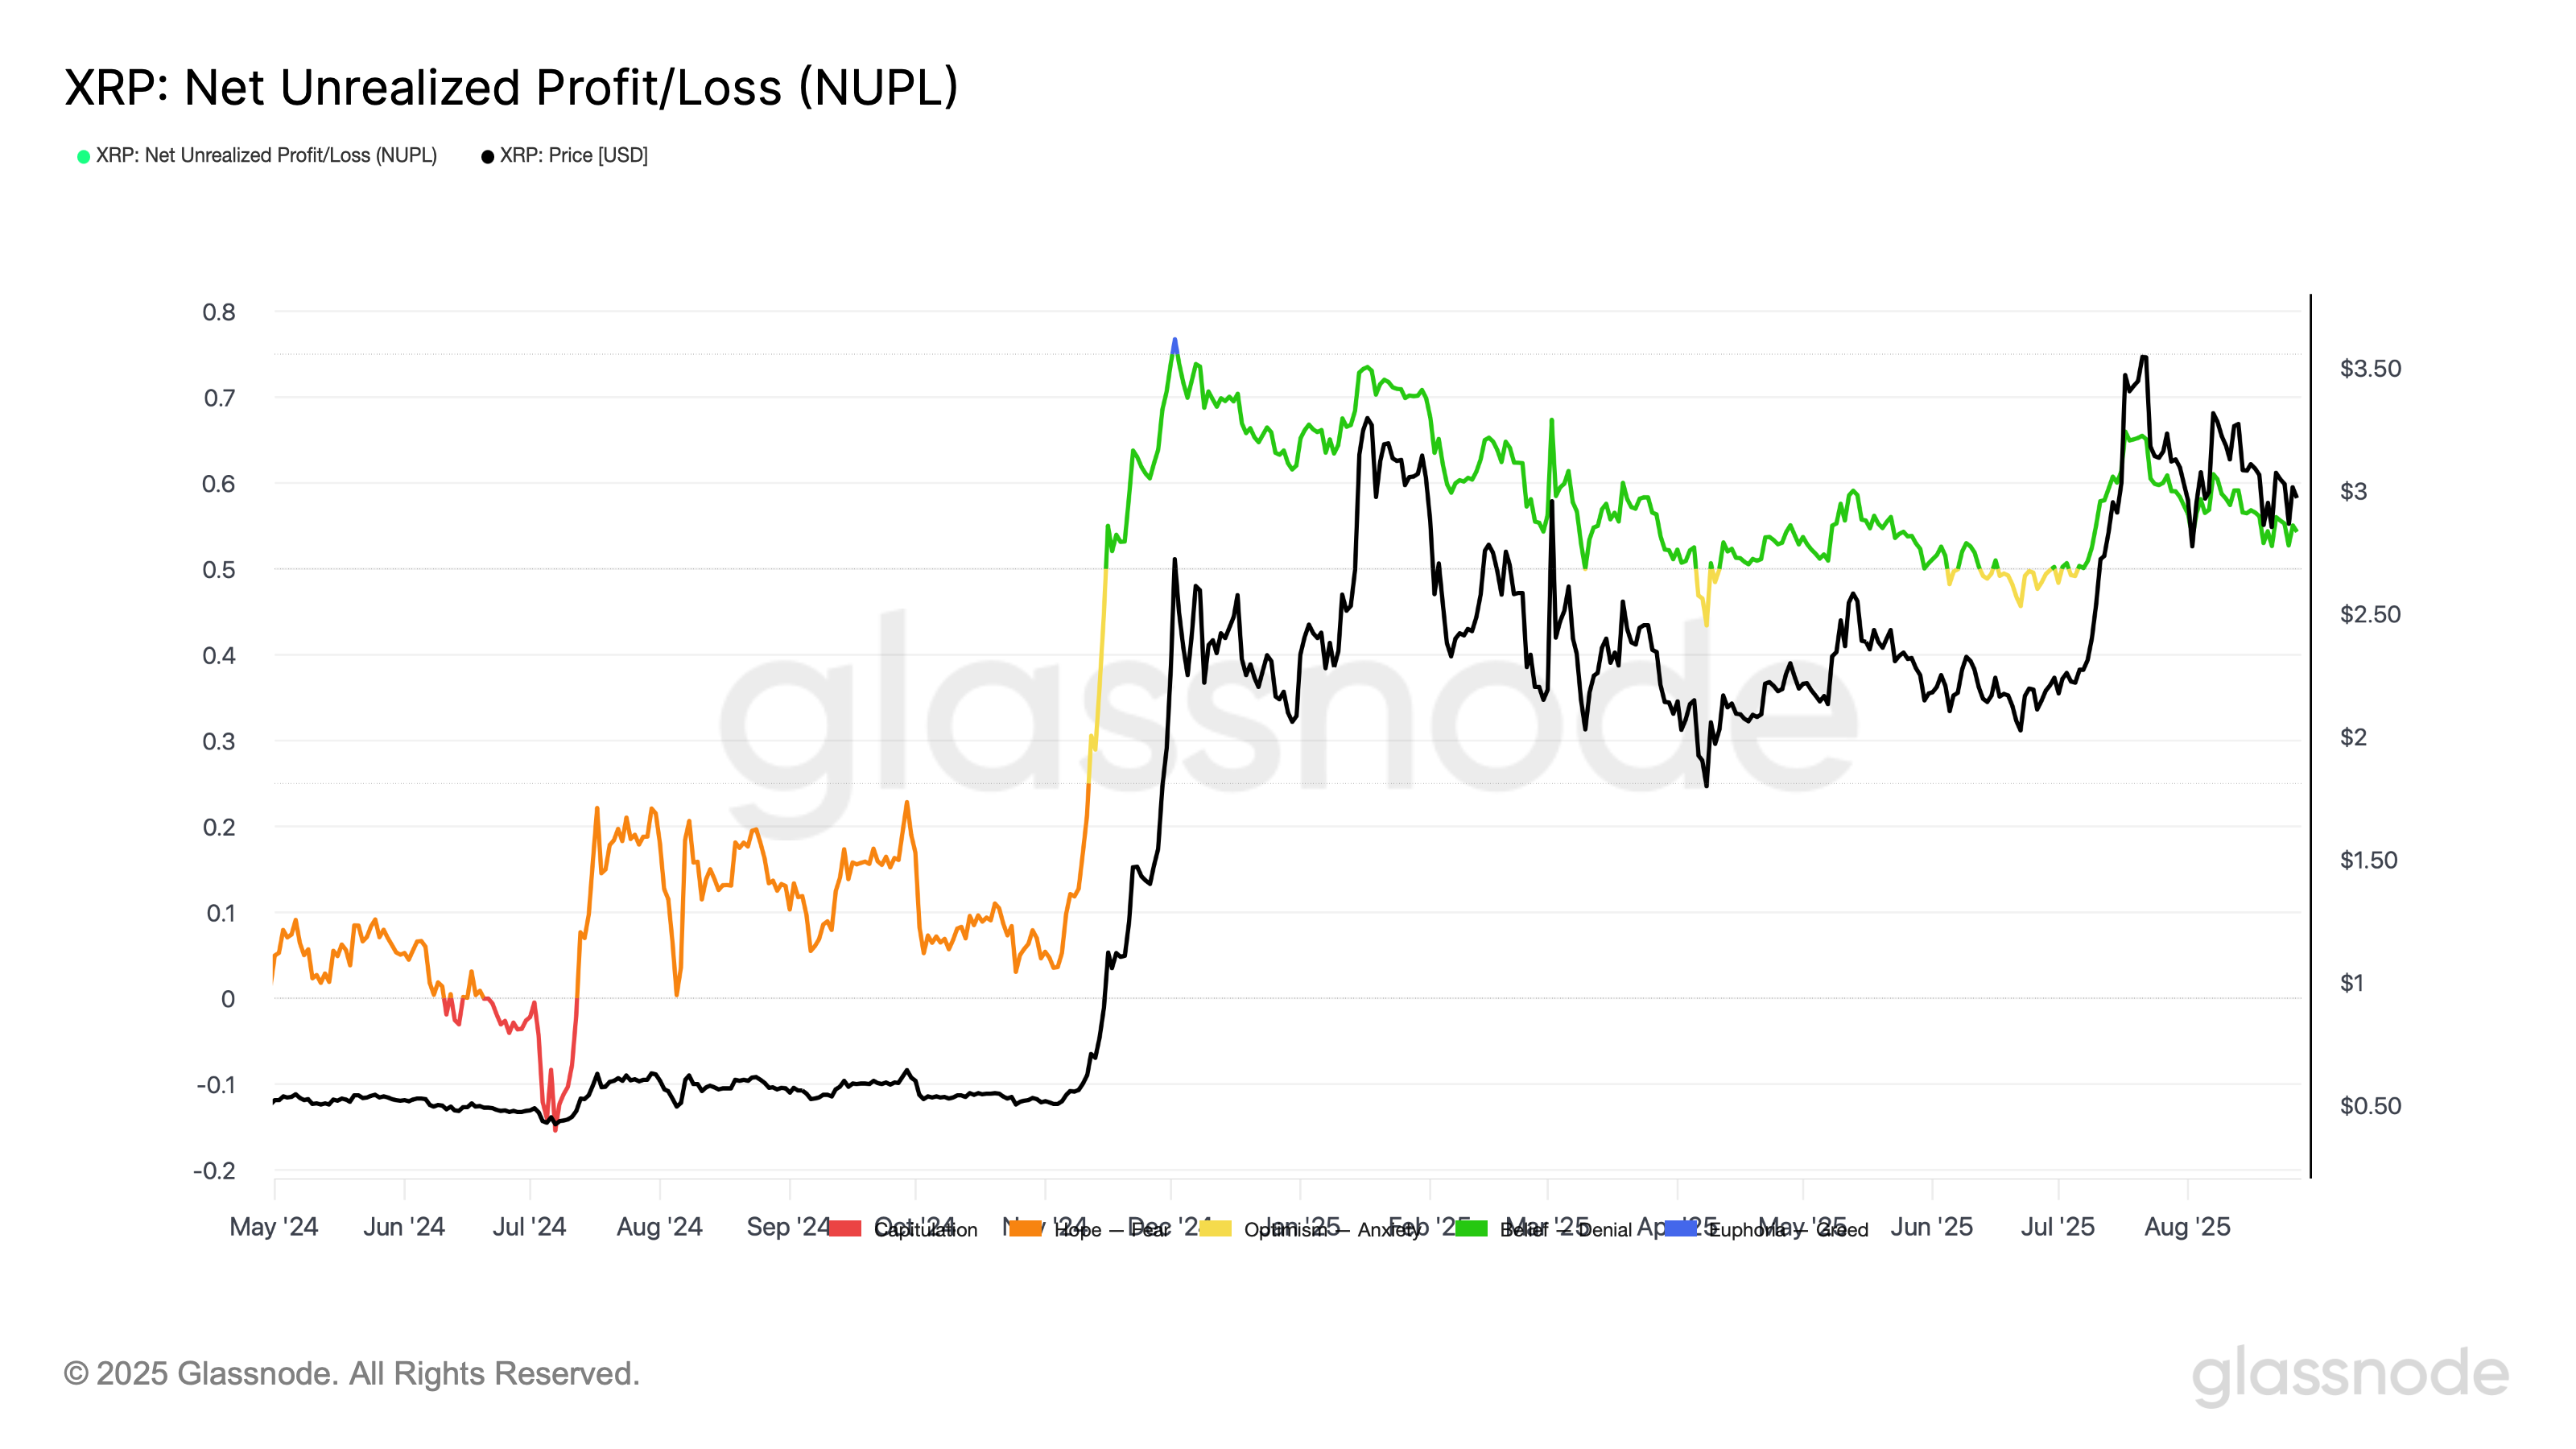
XRP NUPL metric | Source: Glassnode
Technical outlook: XRP bulls target 12% breakout
XRP price is trading around $3.00, extending its consolidation ahead of a potential breakout. The 50-period Exponential Moving Average (EMA) provides support at $2.95 on the 4-hour chart, backing the short-term bullish sentiment.
The Relative Strength Index (RSI), currently sideways below the midline at 48, signals market indecision. Traders will look at the RSI’s return above the midline to assess the uptrend’s strength.
However, with the Moving Average Convergence Divergence (MACD) indicator also sideways below the mean line, the push and pull between the bulls and the bears could last longer than expected.
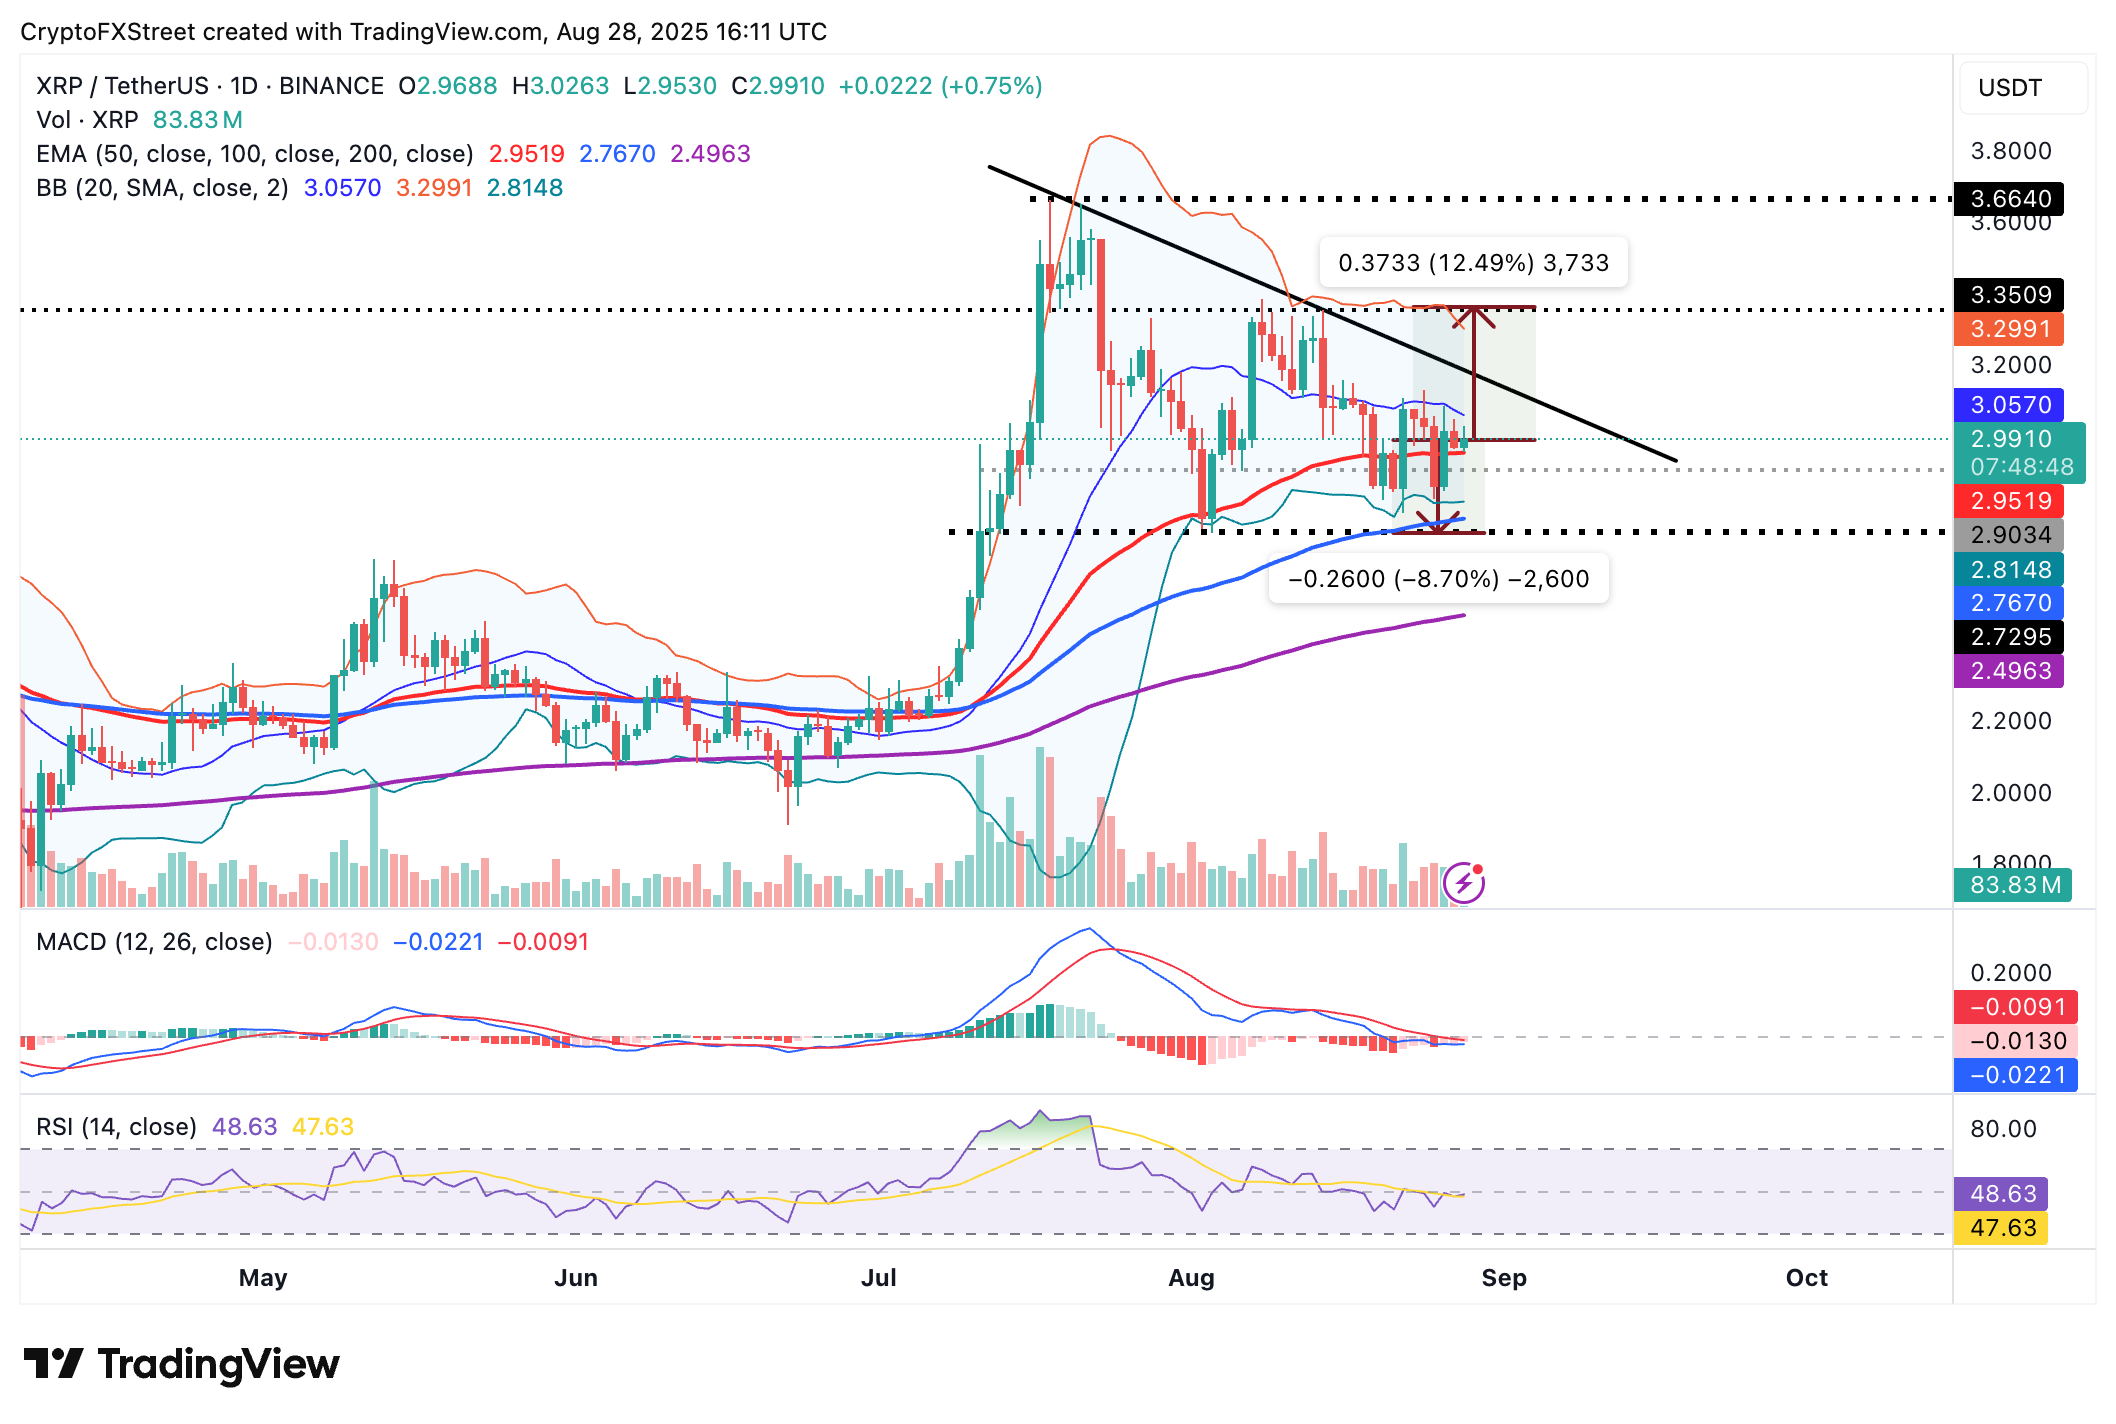
XRP/USDT 4-hour chart
As for the anticipated breakout, traders will look for the blue MACD line to cross above the red signal line, reinforcing the bullish grip. Key areas of interest for traders are the next resistance at $3.35, which was tested on August 15 and the 100-period EMA at $2.76 in the event market dynamics shift and XRP accelerates the decline below the 50-period EMA at $2.95.
Cryptocurrency metrics FAQs
The developer or creator of each cryptocurrency decides on the total number of tokens that can be minted or issued. Only a certain number of these assets can be minted by mining, staking or other mechanisms. This is defined by the algorithm of the underlying blockchain technology. On the other hand, circulating supply can also be decreased via actions such as burning tokens, or mistakenly sending assets to addresses of other incompatible blockchains.
Market capitalization is the result of multiplying the circulating supply of a certain asset by the asset’s current market value.
Trading volume refers to the total number of tokens for a specific asset that has been transacted or exchanged between buyers and sellers within set trading hours, for example, 24 hours. It is used to gauge market sentiment, this metric combines all volumes on centralized exchanges and decentralized exchanges. Increasing trading volume often denotes the demand for a certain asset as more people are buying and selling the cryptocurrency.
Funding rates are a concept designed to encourage traders to take positions and ensure perpetual contract prices match spot markets. It defines a mechanism by exchanges to ensure that future prices and index prices periodic payments regularly converge. When the funding rate is positive, the price of the perpetual contract is higher than the mark price. This means traders who are bullish and have opened long positions pay traders who are in short positions. On the other hand, a negative funding rate means perpetual prices are below the mark price, and hence traders with short positions pay traders who have opened long positions.
Author

John Isige
FXStreet
John Isige is a seasoned cryptocurrency journalist and markets analyst committed to delivering high-quality, actionable insights tailored to traders, investors, and crypto enthusiasts. He enjoys deep dives into emerging Web3 tren


