Ripple price analysis: XRP/USD hovers below $0.33 as bears in retreat
- Ripple's coin has been moving in sync with the market.
- XRP/USD bulls need to clear $0.34 to build upon the upside momentum.

Ripple's XRP hit bottom at $0.2834 on July 16 and managed to recover significantly since that time. The third-largest digital coin with the current market capitalization of $13.7 billion crossed $0.34 barrier and touched $0.3414 on July 20. However, the coin retreated to $0.3290 by the time of writing. While XRP/USD has stayed mostly unchanged both on a day-on-day basis and since the beginning of Monday, it is 7% higher on a week-on-week basis.
Ripple's technical picture
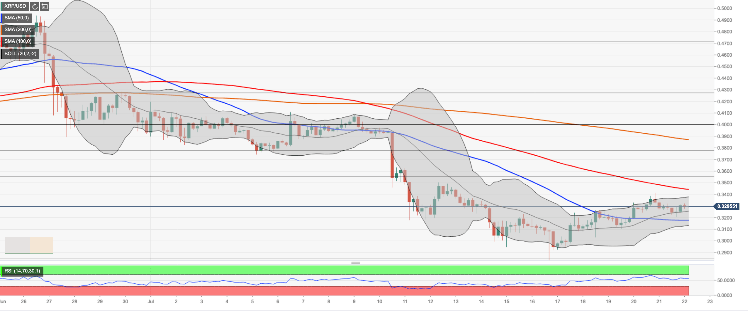
On the intraday charts, XRP/USD bulls have to take the price above the critical $0.33 barrier to mitigate the bearish pressure. However, a stronger barrier is located at $0.34 with the upper line of 4-hour Bollinger Band located on approach. Once it is out of the way, the recovery may be extended towards $0.3440. This barrier is created by a confluence of SMA100 (Simple Moving Average) on 4-hour chart, SMA200 and the middle line of 1-day Bollinger Band.
On the downside, the initial support is seen at $0.3250 (the middle line of 4-hour Bollinger Band), followed by psychological $0.3170 (SMA50, 4-hour). Psychological $0.30 creates another critical support, followed by the recent low of $0.2834. Considering that the short-term RSI (the Relative Strength Index)stays flat in a neutral position, we may suggest that XRP/USD will be sidelined in the nearest future.
XRP/USD, 4-hour chart
Author

Tanya Abrosimova
Independent Analyst


