Ripple price analysis: XRP/USD consolidating within a wedge chart pattern
- Ripple prevailing trend has a high affinity to declines; a possible target is a one-week low ($0.2168).
- The path of least resistance is downside further teasing a triangle breakdown.

Ripple’s XRP lower correction on Monday is by far an extension of the price action in the just-concluded weekend session. The sour tone is across the board starting with the top three cryptocurrencies Bitcoin, Ethereum and Ripple.
After enduring a mundane weekend session traders are hoping for more action this week. However, XRP movements are still suppressed. For instance, following an opening price of $0.2407, Ripple has touched a high of $0.2708 and a low around $0.2381. The current value of $0.2390 follows a 0.7% loss on the day.
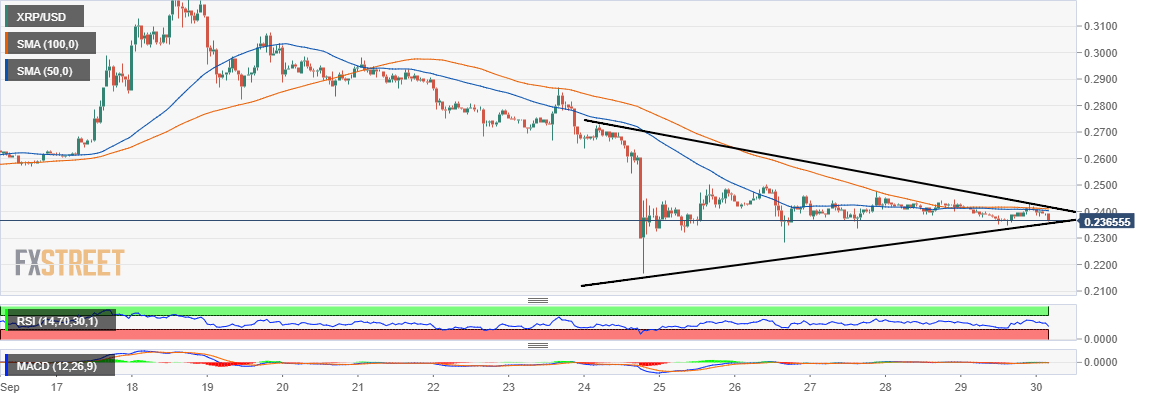
Symmetrical triangle pattern consolidation
The plunge suffered last week found a bottom at $0.2168. This allowed for a subtle recovery that has been going on above a rising trendline. The recovery movement managed to stay above $0.24, however, Ripple’s upside is capped by a descending trendline. The two trendlines converge to form a wedge chart pattern (symmetrical triangle) which is likely to lead to a breakout or a breakdown.
If the price extends the motion above the simple moving averages (both the 50 SMA on the one-hour chart and the 100 SMA) chances for a breakout to levels around $0.2950 will be high. On the flip side, the relative strength index (RSI) downward slopping trend suggests that a breakdown is most likely movement. In the event of another dip, $0.23 is short-term support but the recent low at $0.2168 will come in handy.
XRP/USD 60’ chart
Author

John Isige
FXStreet
John Isige is a seasoned cryptocurrency journalist and markets analyst committed to delivering high-quality, actionable insights tailored to traders, investors, and crypto enthusiasts. He enjoys deep dives into emerging Web3 tren


