Ripple Price Analysis: XRP/USD bounces off key supports to renew bullish bets
- XRP/USD keeps corrective pullback from 100-day SMA, previous resistance.
- Bullish MACD, sustained recovery direct buyers toward the key Fibonacci retracement levels.
- Sellers have yearly support line as an extra barrier to cross for entry.

XRP/USD picks up the bids around 0.3965 during early Thursday. The cryptocurrency pair marked a reversal from 100-day SMA and a six-week-old support line, previous resistance, the previous day.
The recovery moves also gain support from bullish MACD and strong RSI conditions to suggest further upside.
In doing so, 50% and 61.8% Fibonacci retracement levels of November-December 2020 downside, respectively around 0.4780 and 0.5500, gain the market’s attention.
Also acting as an upside barrier is the weekend’s high around 0.5170 and December 17, 2020 peak surrounding 0.6580.
Meanwhile, a downside break of 100-day SMA, at 0.3715 now, will have to drop below the previous resistance line, currently around 0.3430, to revisit the sub-0.3000 area.
However, an upward sloping trend line from December 29 near 0.2600 will be a tough nut to break for the XRP/USD bears, which also holds the key to the 0.2000 threshold and December low of 0.1719.
XRP/USD daily chart
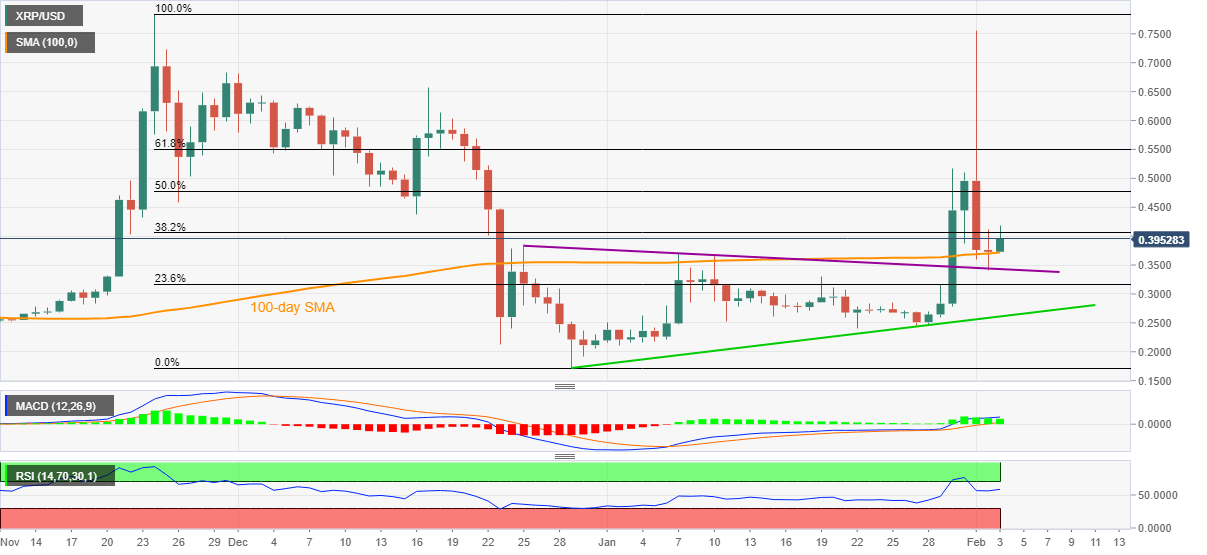
Trend: Bullish
Author

Anil Panchal
FXStreet
Anil Panchal has nearly 15 years of experience in tracking financial markets. With a keen interest in macroeconomics, Anil aptly tracks global news/updates and stays well-informed about the global financial moves and their implications.


