|

Ripple Price Analysis: Are we going to test the recent lows?

  • Ripple is trading 0.60% lower following heavy losses over the weekend.
  • There are lows quite close by that the bears might target.
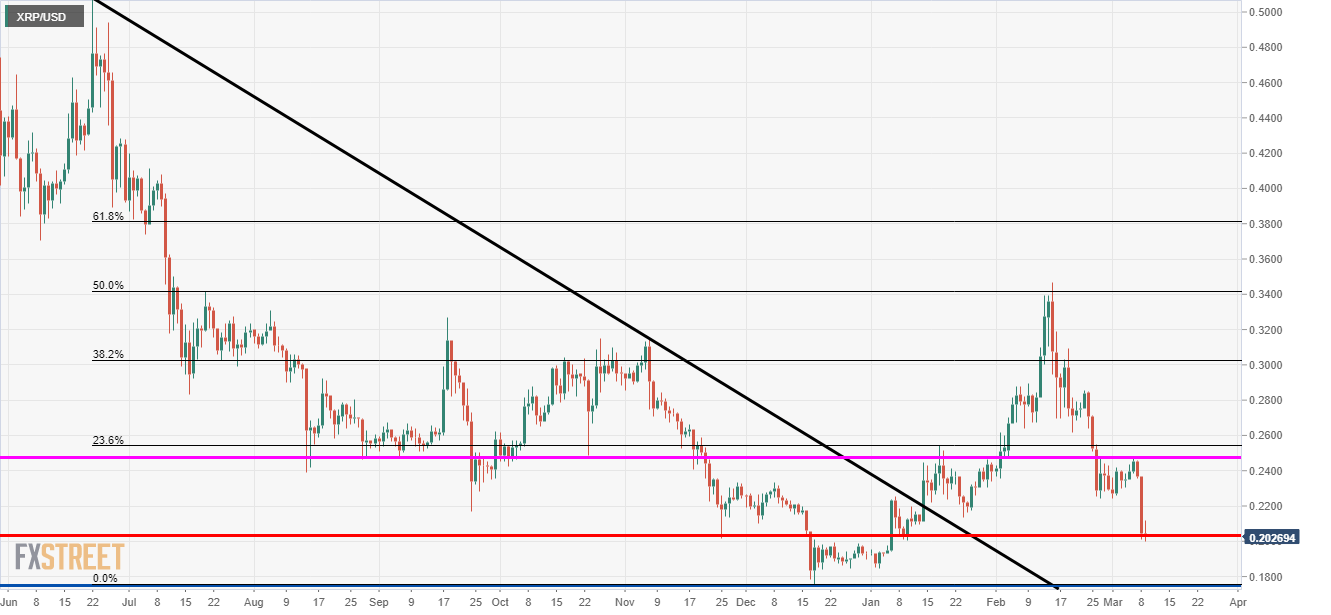
XRP/USD Daily Chart

Ripple is really struggling at the moment after very heavy losses this weekend.

The price is now heading toward the lows of 0.1752 you can see on the daily chart below.

The capitulation from the 50% Fibonacci retracement has been very fast.

The market then pushed below the 0.2475 support and then used the level as resistance for another push lower.

On Monday, the red 0.2025 support has been used but it is still looking vulnerable and this could just be a small blip.

Keep an eye on how the price reacts at the lows as the volume is clearly with the sell-side.

Ripple Price Analysis

Additional Levels

XRP/USD

Overview
Today last price0.2021
Today Daily Change-0.0021
Today Daily Change %-1.03
Today daily open0.2042
 
Trends
Daily SMA200.2499
Daily SMA500.257
Daily SMA1000.2332
Daily SMA2000.2507
 
Levels
Previous Daily High0.2368
Previous Daily Low0.2008
Previous Weekly High0.2468
Previous Weekly Low0.2243
Previous Monthly High0.3467
Previous Monthly Low0.2245
Daily Fibonacci 38.2%0.2145
Daily Fibonacci 61.8%0.223
Daily Pivot Point S10.1911
Daily Pivot Point S20.1779
Daily Pivot Point S30.155
Daily Pivot Point R10.2271
Daily Pivot Point R20.25
Daily Pivot Point R30.2631

Author

Rajan Dhall, MSTA

Rajan Dhall is an experienced market analyst, who has been trading professionally since 2007 managing various funds producing exceptional returns.

More from Rajan Dhall, MSTA
Share:

Editor's Picks

Ripple extends losses as derivatives interest cools

Ripple (XRP) extends its bearish roll near $1.12 support on Friday, reflecting intense headwinds in the broader crypto market largely attributable to macroeconomic pressure.

Crypto Today: Bitcoin, Ethereum, XRP weaken further as capital outflows persist

Macroeconomic headwinds continue to weigh heavily on the cryptocurrency market on Friday, prompting major assets like Bitcoin (BTC) to pare earlier gains and extend losses after June’s brief relief rally.

Bitcoin Weekly Forecast: Recovery hopes fade after the Fed spoils the party

Bitcoin is set to end the week in the red, trading near the 200-Week Simple Moving Average at around $62,300 on Friday. Institutional selling persists, capping BTC’s recovery as spot Exchange Traded Funds point to a sixth consecutive week of outflows.

Sui risks a deeper bearish leg despite on-chain resilience

Sui is down 2% on Friday, extending its decline toward the recent support leg formed at $0.6618. The Total Value Locked in the Sui ecosystem has stabilized around 600 million SUI tokens, reflecting resilient user demand.

Bitcoin: Recovery hopes fade after the Fed spoils the party
Bitcoin (BTC) is set to end the week in the red, trading near the 200-Week Simple Moving Average (SMA) at around $62,300 on Friday. Institutional selling persists, capping BTC’s recovery as spot Exchange Traded Funds (ETFs) point to a sixth consecutive week of outflows.