Ripple chart on January 31: Profit-taking pushes XRP below $0.33
- XRP/USD is the winner of the day with over 13% of gains.
- The correction sets in due to speculative positioning.

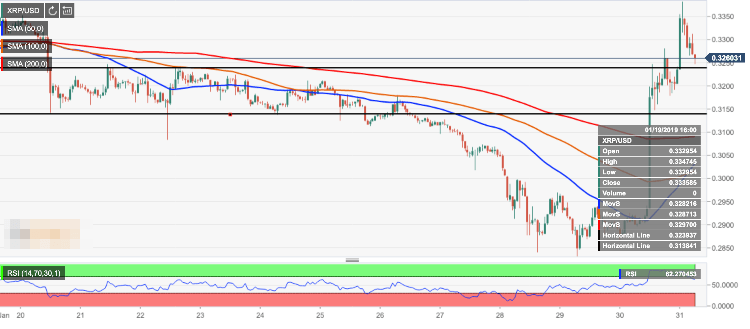
XRP/USD is changing hands at $0.3270, off the recent high reached at $0.3382. The coin is the growth leader of the day, that managed to gain over 13% in recent 24 hours amid positive fundamental news.
Ripple’s XRP is now the second largest coin with the market value over $13B. The coin experienced strong growth of average daily trading volumes on Wednesday (over 700M against $450 on Tuesday) amid buying interest.
However, at this point, XRP/USD has reversed from the recent lows due to speculative positioning and technical factors.
The Relative Strength Index has reverted from an overbought territory on intraday charts, which implies that the downside momentum may gain traction within the nearest sessions.
Looking technically, the first support comes at $0.3240. It is created by the upper border of the previous channel. Once it is cleared, the downside may be extended towards $0.3180 (the lower boundary of the said channel) and $0.3090 (SMA200, 1-hour).
Meanwhile, $0.3000 handle is regarded as critical support. A sustainable move lower will reverse recent gains and put XRP back on the downside track.
In terms of further growth, we need to see a move above $0.33 handle and a retest of the recent high at $0.3382. In this case, XRP/USD will proceed to the psychological $0.3400 and $0.3422 (January 19 high).
Author

Tanya Abrosimova
Independent Analyst


