Quant price is poised for a rally as on-chain data and price action show a bullish outlook
- Quant price breaks out of the falling wedge pattern, eying for a rally ahead.
- Coinglass data shows that QNT’s open interest is increasing, indicating new buying is occurring in the market.
- On-chain data paints a bullish picture, as the exchange flow balance shows a negative spike, Daily Active Addresses are rising, and the supply on exchanges decreases.
- A daily candlestick close below $56.8 would invalidate the bullish thesis.
Quant’s (QNT) price, the token of a London-based blockchain technology company dedicated to improving network interoperability, recently broke out of a falling wedge pattern, hinting at a potential rally. This bullish price action is supported by increasing open interest, a negative spike in exchange floor balance, rising daily active addresses, and a decreasing supply on exchanges, all of which indicate a potential rally for Quant’s price on the horizon.
Quant price shows potential for a rally
QNT broke out of the falling wedge pattern on Sunday. This pattern was formed by connecting multiple highs and lows with a trendline from mid-April, and the breakout signals a bullish trend ahead. On Monday, it continues to trade higher by 2% at $70.5.
If the breakout level at $67.4 level holds as support, QNT could rally 20% from its current level to restest its weekly resistance level at $85.2.
The Relative Strength Index (RSI) on the daily chart has flipped over its neutral level of 50, and the Awesome Oscillator (AO) is about to flip over its neutral level of zero. For the bullish momentum to be sustained, both indicators must remain above their neutral levels for the ongoing bullish rally.
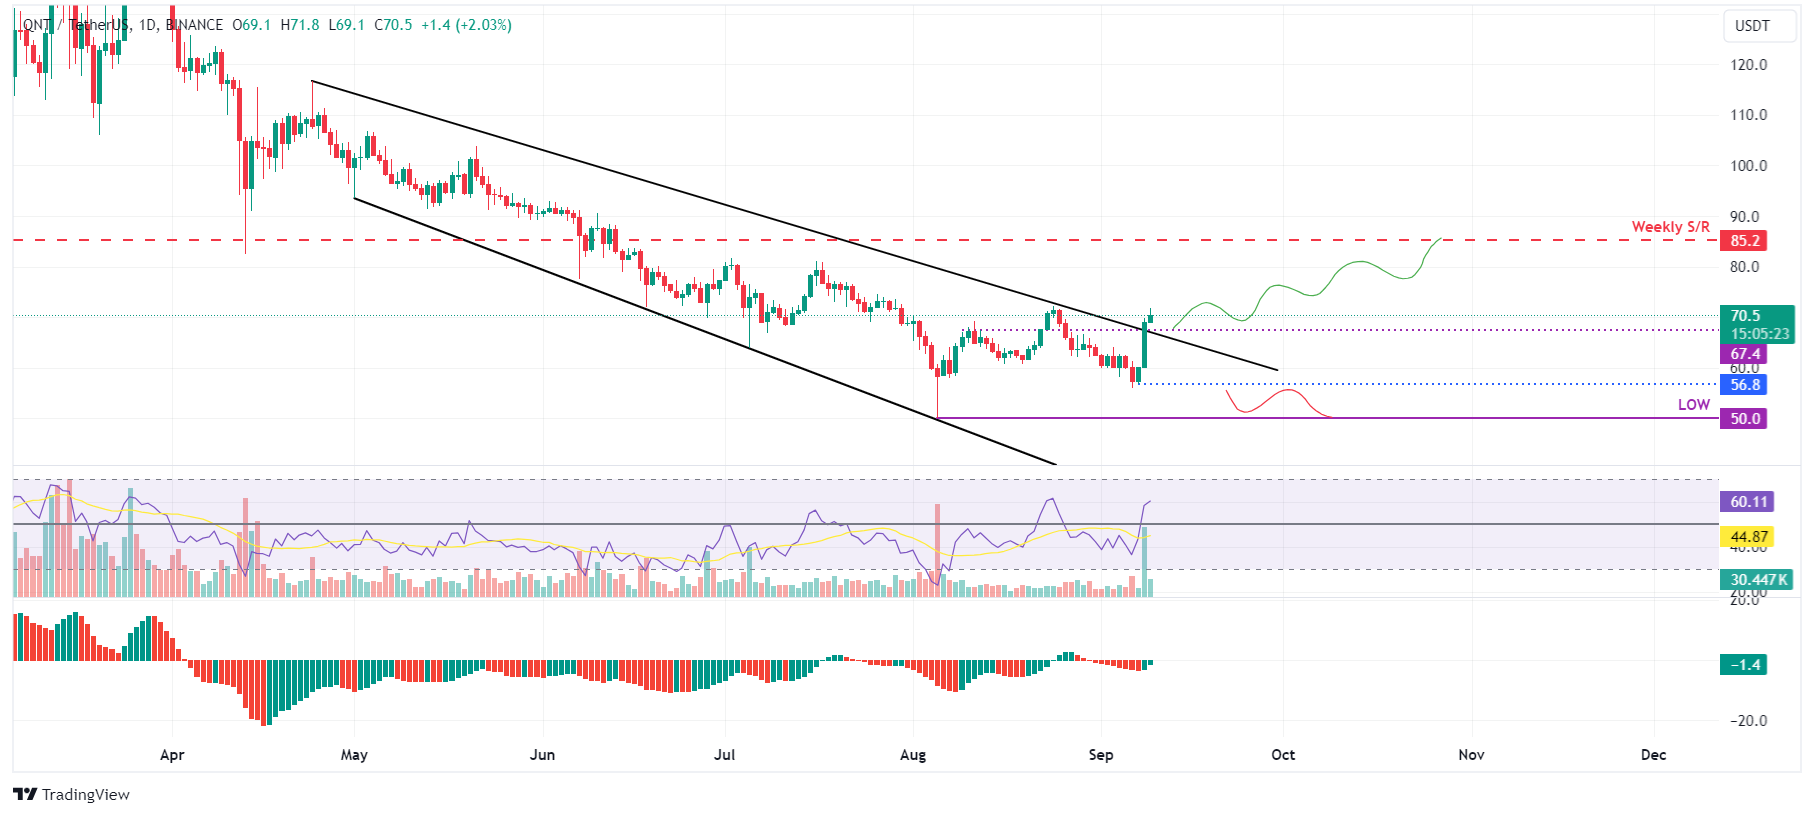
QNT/USDT daily chart
Quant on-chain data shows a positive trend
Coinglass’s data shows that the futures’ Open Interest (OI) in Quant at exchanges is also increasing. The OI indicates the total number of outstanding derivative contracts that have not been settled (offset by delivery) and whether money flows into the contract are increasing or decreasing.
Increasing OI represents new or additional money entering the market and new buying, which suggests a bullish trend. When OI decreases, it is usually a sign that the market is liquidating, more investors are leaving, and the current price trend is ending.
The graph below shows that QNT’s OI increased from $6.63 million on Sunday to $14.06 million on Monday, its highest level since the end of June. This indicates that new or additional money is entering the market and new buying is occurring.
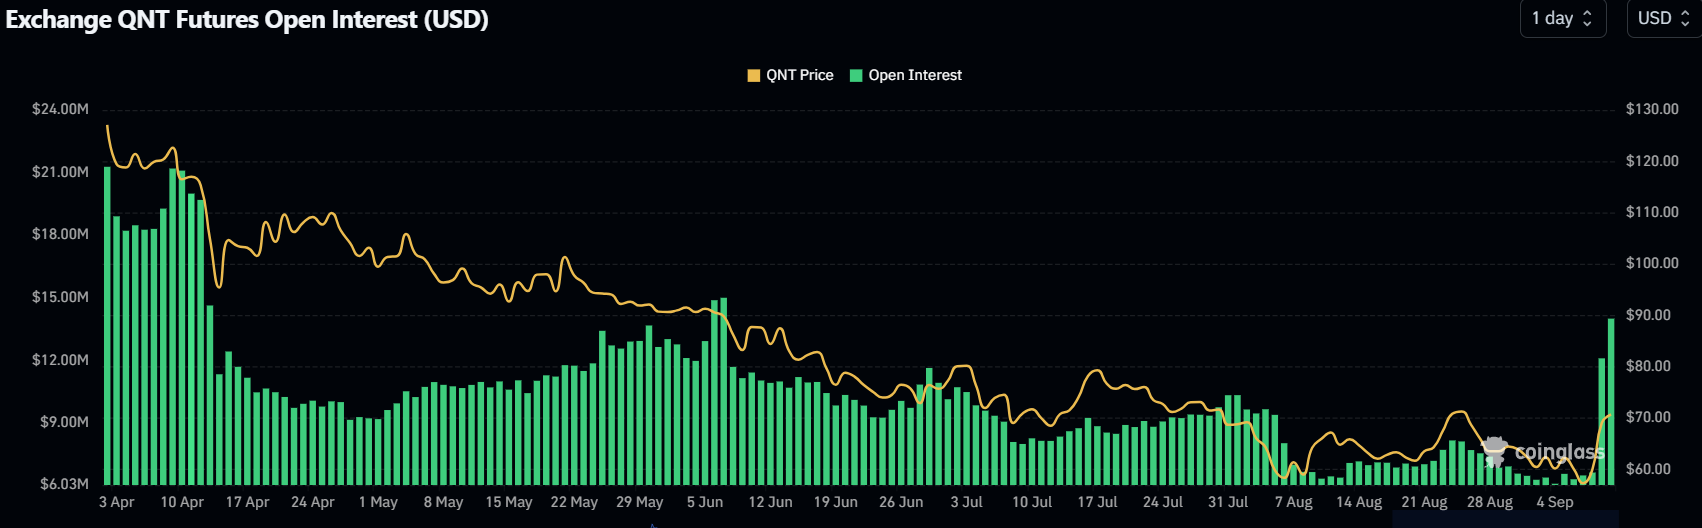
QNT Open Interest chart
Santiment’s Daily Active Addresses index paints a bullish outlook for Quant. A rise in the metric signals greater blockchain usage, while declining addresses point to lower demand for the network.
In Quant’s case, this metric has risen from 531 on Thursday to 2763 on Friday. This rise is the highest since November 2022 and indicates that demand for QNT’s blockchain usage is increasing, which could rally Quant’s price.
%20[12.11.15,%2009%20Sep,%202024]-638614723720746570.png)
QNT Daily Active Addresses chart
Santiment’s Exchange Flow Balance shows the net movement of tokens into and out of exchange wallets. A positive value indicates more tokens entered into the exchanges than exited, suggesting selling pressure from investors. Conversely, a negative value indicates more tokens left the exchange than entered, indicating less selling pressure from investors.
In Quant’s case, the Exchange Flow balance slumped from 299.32 million to -85,514 from September 1 to September 2. This negative spike indicates increased investor confidence. QNT’s Supply on Exchanges declined by 5.38% during the same period. This is a bullish development, further denoting investor confidence in Quant.
%20[12.30.39,%2009%20Sep,%202024]-638614724174947205.png)
Quant Exchange Flow Balance and Supply on Exchanges
However, if Quant’s daily candlestick closes below the September 7 low of $56.8, the outlook will shift to bearish. This scenario could lead to a 12% crash to retest its August 5 low of $50.00.
Author

Manish Chhetri
FXStreet
Manish Chhetri is a crypto specialist with over four years of experience in the cryptocurrency industry.


