Fantom price is set for a rally after retesting key support level
- Fantom price retested and found support around the $0.364 level, eyeing a rally ahead.
- Supply Distribution data shows that one cohort of whales bought FTM during the recent price dip.
- On-chain data paints a bullish picture, as FTM’s long-to-short ratio is above one.
- A daily candlestick close below $0.364 would invalidate the bullish thesis.

Fantom (FTM) price found support around the crucial support level of $0.364 on Friday and rallied 12.5% over the weekend. On Monday, it continues to trade higher by 3.8% at $0.429. Recent moves from large-wallet investors suggest that Fantom could hold above this key technical level and is eyeing a rally, as evidenced by a long-to-short ratio above one.
Fantom price is poised for a rally following a retest of crucial support level
Fantom price retested the falling wedge breakout level at $0.364 on Friday and rose 12.5% the next two days. This level at $0.364 coincides with the 61.8% Fibonacci retracement level (drawn from a swing low of $0.257 on August 5 to a swing high of $0.536 on August 25), making it a key reversal zone. At the time of writing on Monday, trades continue to trade higher by $3.8% at $0.429.
If the $0.364 level continues to hold as support, FTM could rally 27% to retest its daily resistance level at $0.542.
The Relative Strength Index (RSI) on the daily chart has flipped over its neutral level of 50, and the Awesome Oscillator (AO) is about to flip over its neutral level of zero. For the bullish momentum to be sustained, both indicators must remain above their neutral levels for the ongoing bullish rally.
Suppose the bulls are aggressive and the overall crypto market outlook is positive. In that case, FTM closes above the $0.542 daily resistance level, which could extend an additional rally of 12.5% to retest its July 1 high of $0.610.
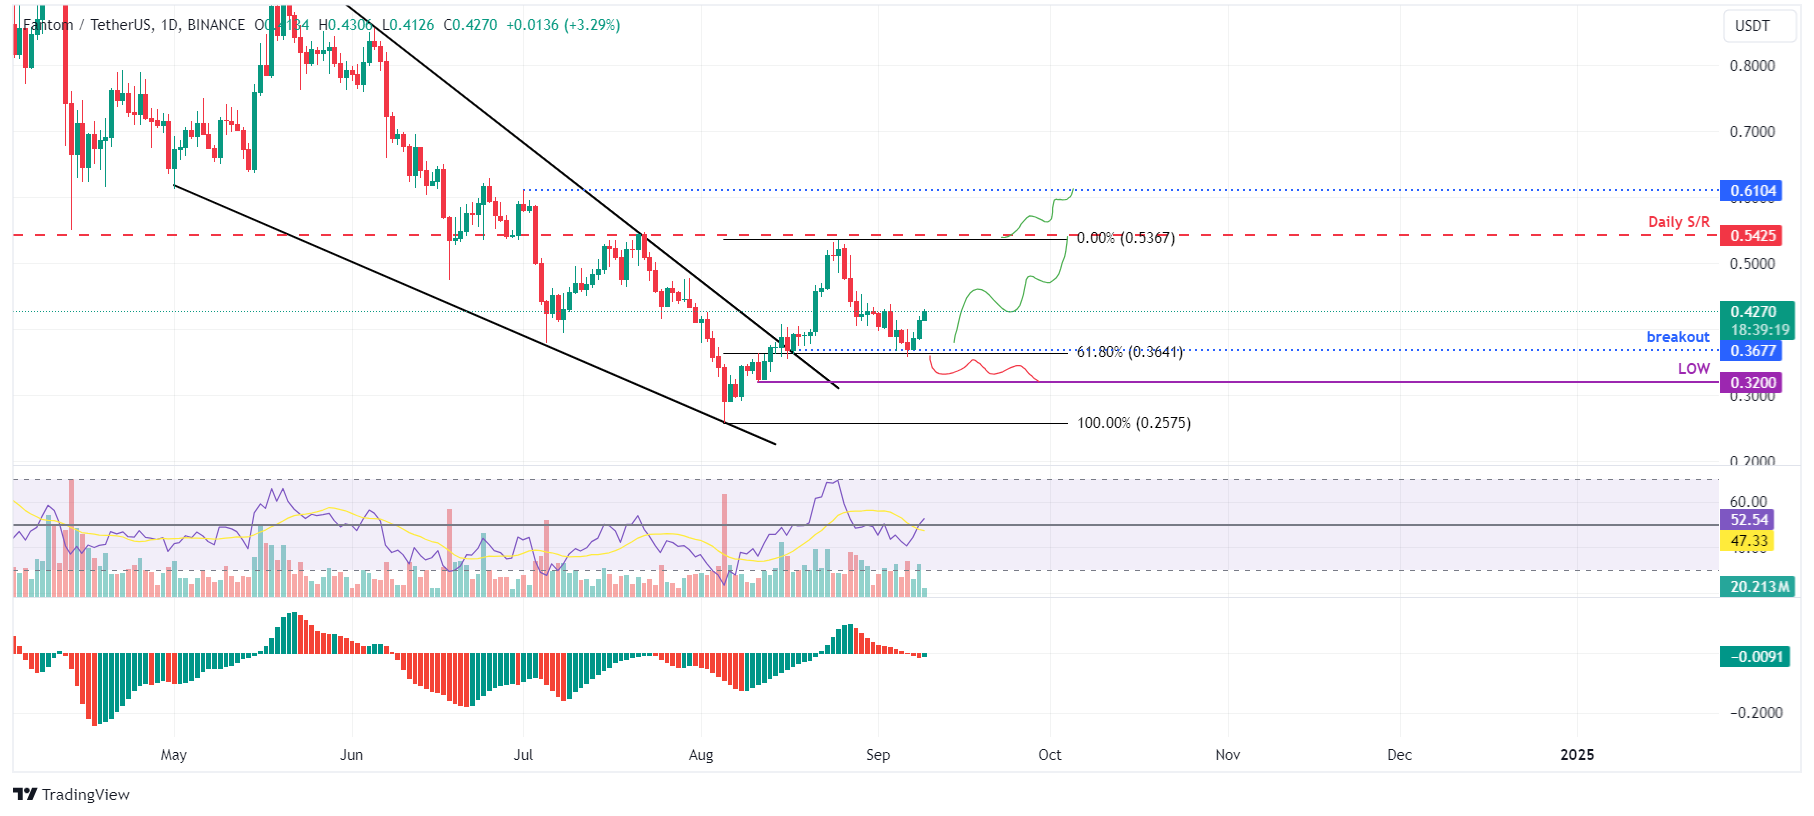
FTM/USDT daily chart
Santiment’s Supply Distribution metric shows that the whales holding FTM tokens between 100,000 to 1 million dropped from 105.85 million on Thursday to 104.75 million on Sunday. Meanwhile, wallets holding 1 million to 10 million FTM surged from 214.43 to 216.87 million in the same period.
This development shows that the first cohort of whales could have fallen prey to the capitulation event. In contrast, the second set of wallets seized the opportunity and accumulated Fantom at a discount during the recent price dip, bolstering investors’ confidence in FTM.
%20[10.20.22,%2009%20Sep,%202024]-638614581336852670.png)
FTM Supply Distribution metric chart
Additionally, Coinglass’s data shows that FTM’s long-to-short ratio stands at 1.01. This ratio reflects bullish sentiment in the market, as the number above one suggests that more traders anticipate the price of the asset to rise, bolstering Fantom’s bullish outlook.
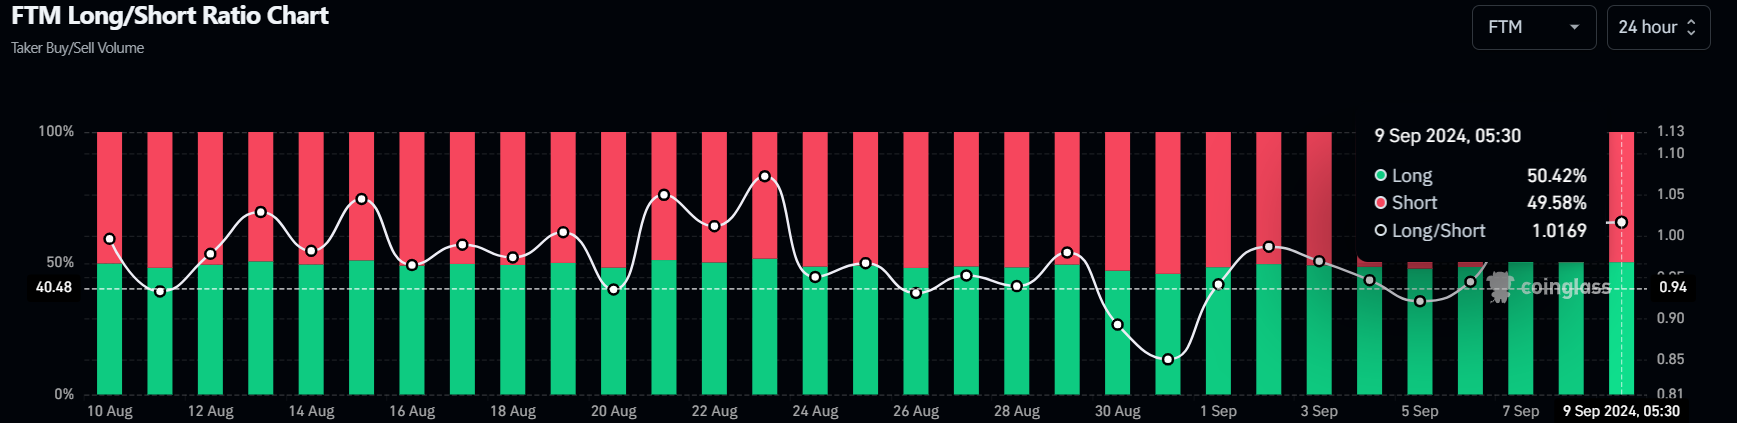
FTM/USDT daily chart
Even though the on-chain metric and technical analysis point to a bullish outlook, if FTM’s daily candlestick closes below the $0.364 level, this move would invalidate the bullish thesis by producing a lower low on a daily timeframe. This development could cause Fantom’s price to crash 12.5% to the August 11 low of $0.320.
Author

Manish Chhetri
FXStreet
Manish Chhetri is a crypto specialist with over four years of experience in the cryptocurrency industry.


