Quant Price Forecast: QNT targets $143 as on-chain data signals bullish outlook
- Quant rally gains traction with the recent announcement of Quant Flow at EBAday 2025 in Paris.
- With a growing number of profitable QNT holders, positive sentiments build up for Quant.
- QNT's technical outlook suggests a potential breakout run to extend the monthly gains.

Quant (QNT) trades at $119, recording an 11% surge at press time on Wednesday, following the announcement of Quant Flow at EBAday in Paris on Tuesday. With the bull run, the majority of QNT holders are now profitable, and an optimistic technical outlook suggests a potential breakout from a high supply zone.
Quant Flow opens the gate for institutions and enterprises
Quant announced a Quant Flow feature in Overledger Fusion alongside its PayScript engine. This enhances a simple transaction with advanced programmability and automation features. At the EBAday in Paris, Gilbert Verdian, founder and CEO at Quant, shared a panel with Barclays, EPAM, and Bain & Co to discuss the future of fintechs and banks.
The announcement comes a day after the unveiling of Overledger Fusion, the world’s first layer 2.5 network for institutions, enterprises, and Decentralized Finance (DeFi) ecosystems. With the Fusion upgrade, Quant’s Overledger will gain a multi-ledger rollup technology feature, enabling the creation of a multi-chain network and improving operability across multiple layer-1 networks.
Quant rally faces supply zone at $125
Quant is up by 25% so far this week, printing its third consecutive bullish candle on the daily chart at the time of writing. QNT’s recovery above the $100 psychological mark marks a breakout from an inverted head and shoulders pattern, signaling a trend reversal.
The pattern formed after a 64% drop from the closing price of $165.90 on December 7 to the closing price of $59.90 on April 8. A Fibonacci retracement over the mentioned 64% drop reveals a 50% halfway level at $112.90.
As QNT surpasses the 50% Fibonacci retracement, investors must remain cautious, as players with a lower buying price could book profits. However, it also marks a trend reversal for Quant, signaling upside chances.
Supporting the reversal thesis, the Moving Average Convergence/Divergence (MACD) indicator crosses above its signal line, triggering a bullish crossover and reflecting a surge in bullish momentum. The resurfacing of positive histogram bars provides an additional boost to the thesis of trend reversal.
The 50-day Exponential Moving Average (EMA) at $89.61 exceeds the 200-day EMA at $87.75, triggering a golden cross and supporting the bull run chances as short-term price action overcomes the longer period movement.
The uptrend in QNT nears the supply zone extending from $121 to $125, with the upper boundary coinciding with the 61.8% Fibonacci level. With an increasing number of technical signals suggesting a breakout possibility, Fibonacci levels highlight the next key resistance at $143.22, which aligns with the 78.6% retracement level.
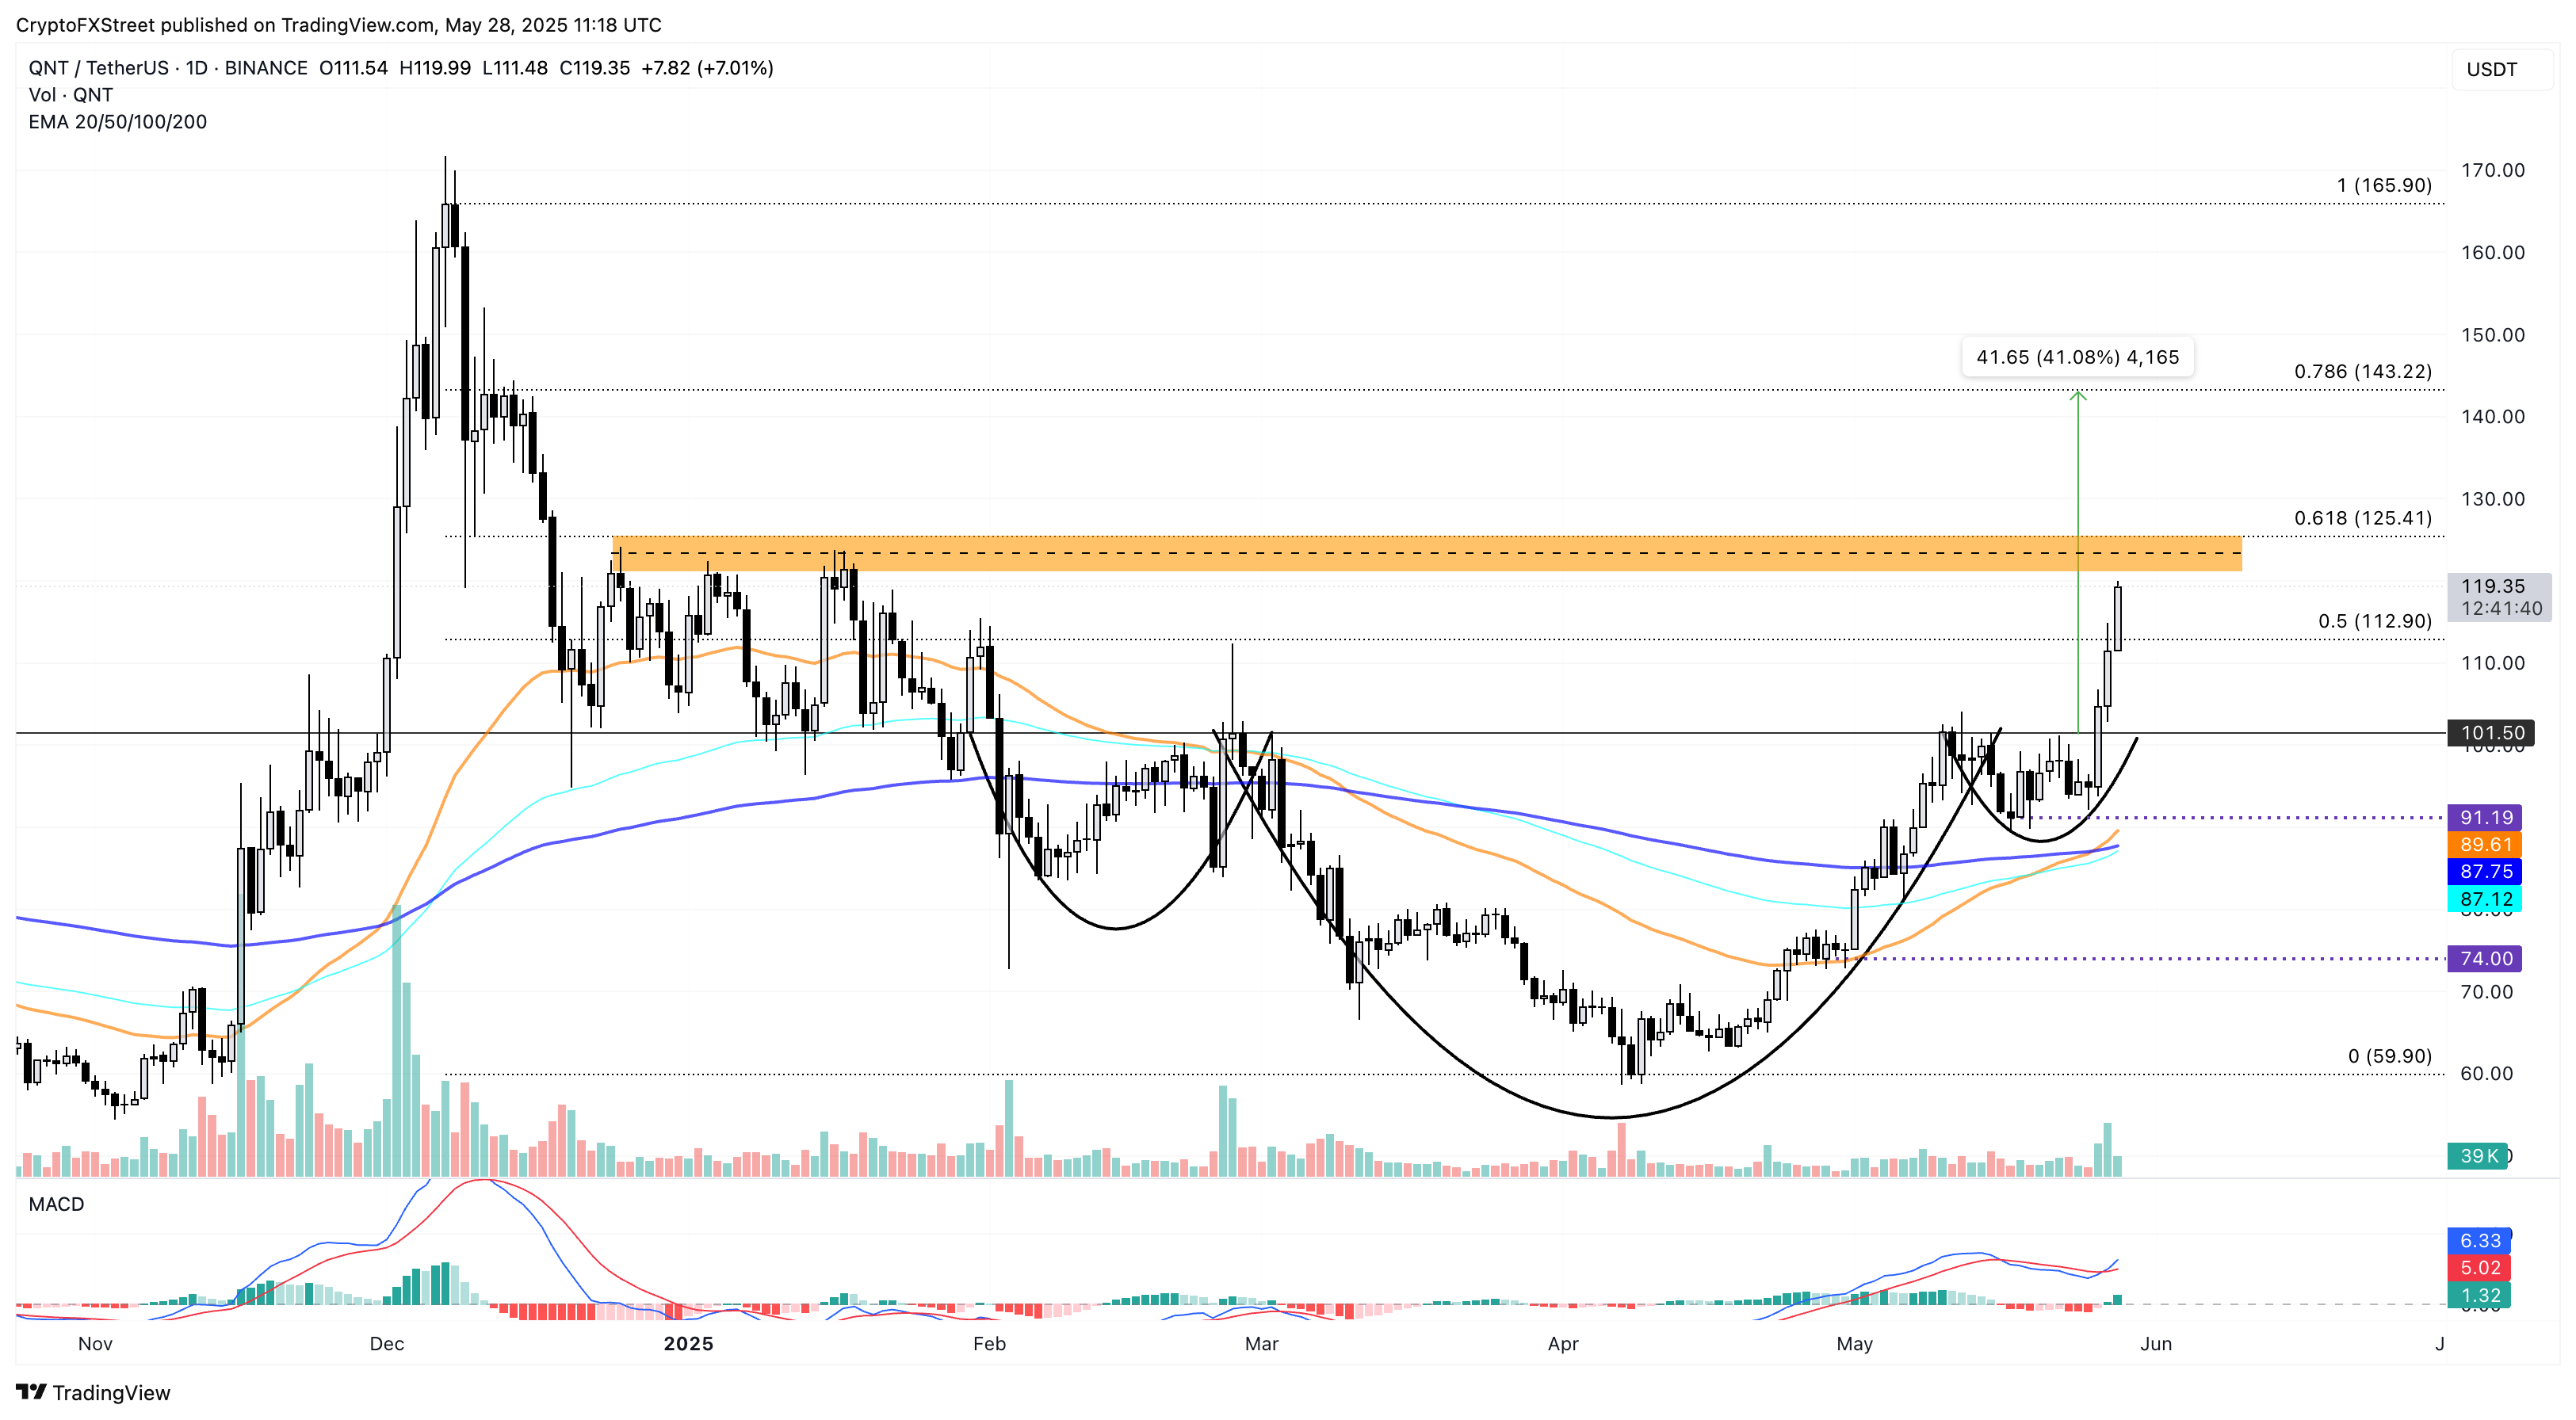
QNT/USDT daily price chart. Source: Tradingview
Conversely, a reversal from the supply zone could result in the retest of the 50% Fibonacci retracement at $112.90.
Profitable QNT holders to push uptrend
According to IntoTheBlock’s Global In/Out of Money (GIOM) data, 85% of QNT holders are “In the Money” with buying pressure below the current market price. The GIOM chart reveals that 18.22K investors with a buying price between $115.62 and $124.37 hold 668.06K QNT tokens in an “At the Money” zone.

Global In/Out of the Money indicator. Source: IntoTheBlock
According to this metric, the immediate resistance zone for Quant lies between $124.37 and $143.94, with 17.87K investors holding 1.03 million QNT tokens at an average price of $133.37. As larger participants are “In the Money,” a pullback could be absorbed by investors in profit, likely to average dollar-cost value.
Author

Vishal Dixit
FXStreet
Vishal Dixit holds a B.Sc. in Chemistry from Wilson College but found his true calling in the world of crypto.


