Quant extends gains, aiming for $120, as risk-on sentiment returns
- Quant rises for the second straight day, trading above $100, supported by increasing risk appetite among large-volume holders.
- QNT's daily active addresses jump to 1,000, signaling network growth and user engagement.
- The MACD validates Quant's uptrend with a buy signal, but the near-overbought RSI cautions traders to temper expectations.

Quant's (QNT) price hovers around $109 at the time of writing on Tuesday, with intraday gains nearing 5%, supported by strong sentiment in the broader crypto market and growing interest among investors, particularly large-volume holders.
Quant enters accumulation phase
The bullish momentum propelling Quant's price above $100 likely emanates from the increasing risk-on sentiment among whales. Santiment's on-chain data shows a sharp increase in the percentage of supply held by addresses holding between 100,000 and 1 million coins.
This cohort of QNT holders currently accounts for approximately 32% of the total supply, up from around 30% on May 5. The yellow line on the chart below shows two short-lived peaks above 32% on May 19 and May 22, suggesting active profit-taking even as Quant's price extends gains.
 [13-1748347059598.48.56, 27 May, 2025].png)
Quant Supply Distribution | Source: Santiment
The token's performance on-chain has also been on the rise, with the number of daily active addresses increasing from 720 on Sunday to 1,059 on Monday, representing a 32% rise.
Notably, the Daily Active Addresses metric, which tracks the unique addresses that transact QNT daily on the protocol, is also rising. This tool can be used to gauge the level of user engagement and speculation. A consistent increase in this metric often signals improving confidence among investors, which translates to a boost in demand for the token.
 [13-1748347081397.48.45, 27 May, 2025].png)
Quant Daily Active Addresses metric | Source: Santiment
At the same time, the number of new addresses joining the blockchain protocol has gradually increased to 298 from approximately 107 on April 5, despite noticeable volatility in recent weeks. The 64% surge in the number of newly created addresses signals growing network adoption, which could steady the ongoing uptrend as demand for QNT increases.
 [14-1748347105448.30.42, 27 May, 2025].png)
Quant Network Growth metric | Source: Santiment
Technical outlook: Quant upholds bullish structure
Quant's price is approaching the short-term resistance at $110 as part of a larger recovery, targeting highs above $120. The token sits on top of key levels such as the upper descending trendline and the confluence support area between $87 and $90, bringing together the 50-day Exponential Moving Average (EMA), the 100-day EMA and the 200-day EMA.
A buy signal from the Moving Average Convergence Divergence (MACD) indicator validated on Monday backs the uptrend. The signal occurred when the blue MACD line crossed above the red signal line.
Traders would look out for the MACD's continued uptrend above the mean line to ascertain the bullish momentum in upcoming sessions and days. If the MACD reverses toward the center line, it will imply fading bullish momentum amid potential profit-taking.
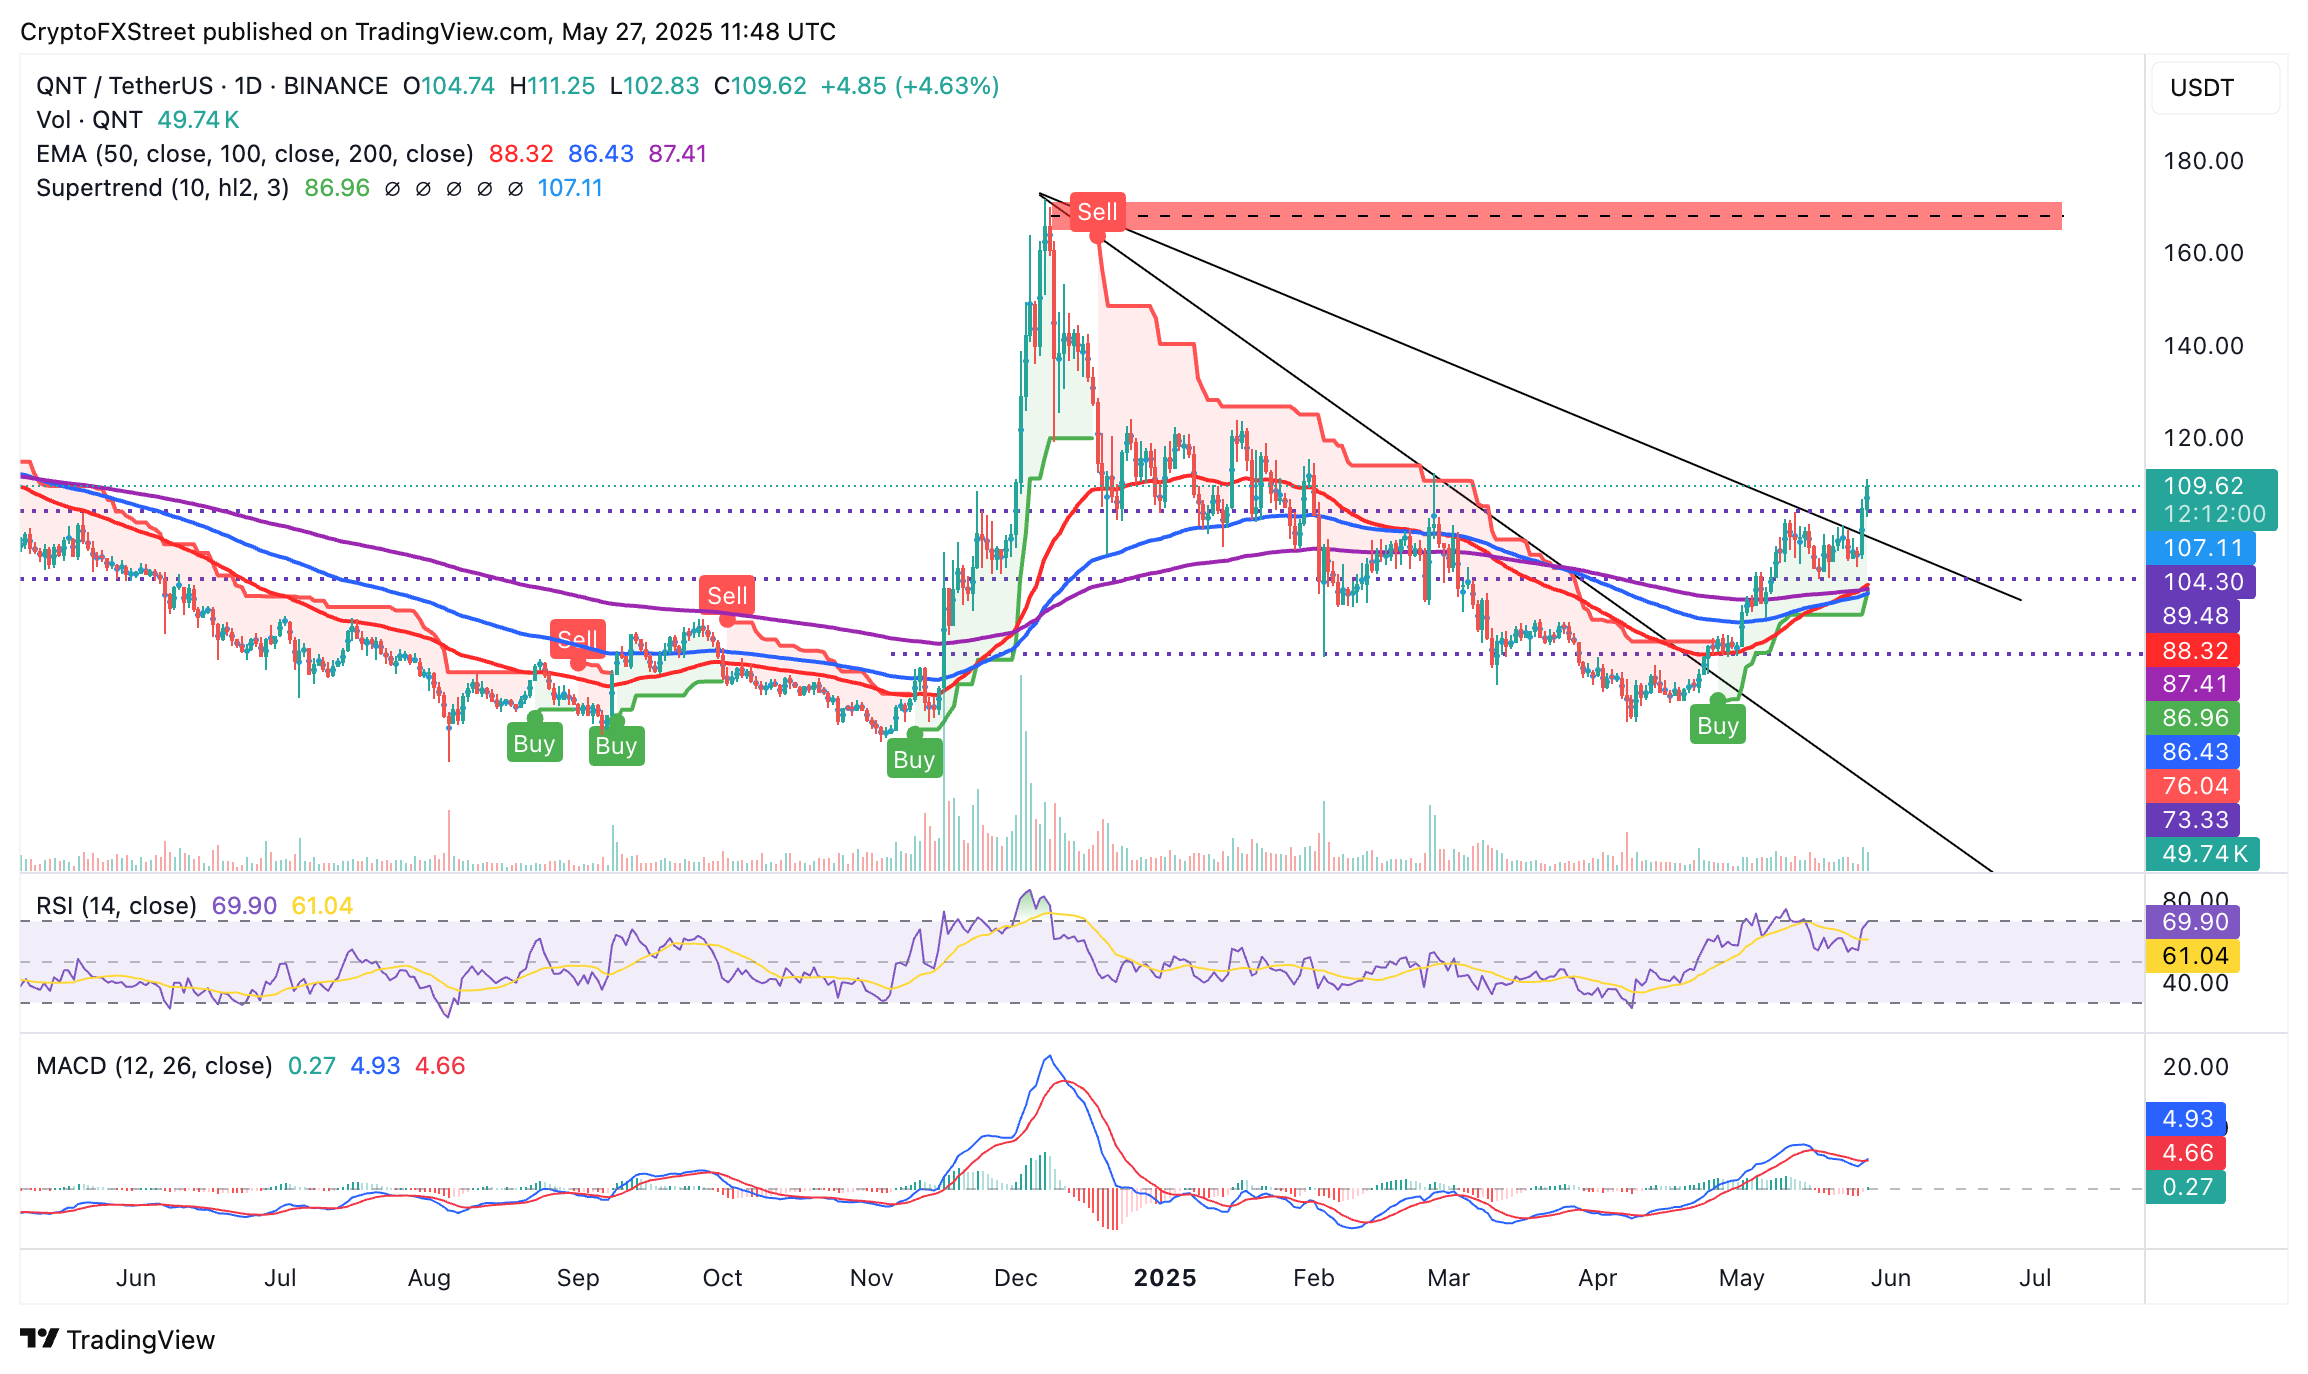
QNT/USDT daily chart
Still, the near-overbought Relative Strength Index (RSI) at 69 signals caution for traders, as overbought conditions are often a precursor to potential pullbacks. That said, a break above the immediate $110 resistance could reinforce the bullish grip on QNT, bringing the next key level at $120 into sight.
On the other hand, key monitoring levels on the downside range from near-term support at $100, which was tested as resistance on May 22, to the confluence zone between $87 and $90, as well as the demand area at $73, which was tested as the 50-day EMA in late April.
Cryptocurrency metrics FAQs
The developer or creator of each cryptocurrency decides on the total number of tokens that can be minted or issued. Only a certain number of these assets can be minted by mining, staking or other mechanisms. This is defined by the algorithm of the underlying blockchain technology. On the other hand, circulating supply can also be decreased via actions such as burning tokens, or mistakenly sending assets to addresses of other incompatible blockchains.
Market capitalization is the result of multiplying the circulating supply of a certain asset by the asset’s current market value.
Trading volume refers to the total number of tokens for a specific asset that has been transacted or exchanged between buyers and sellers within set trading hours, for example, 24 hours. It is used to gauge market sentiment, this metric combines all volumes on centralized exchanges and decentralized exchanges. Increasing trading volume often denotes the demand for a certain asset as more people are buying and selling the cryptocurrency.
Funding rates are a concept designed to encourage traders to take positions and ensure perpetual contract prices match spot markets. It defines a mechanism by exchanges to ensure that future prices and index prices periodic payments regularly converge. When the funding rate is positive, the price of the perpetual contract is higher than the mark price. This means traders who are bullish and have opened long positions pay traders who are in short positions. On the other hand, a negative funding rate means perpetual prices are below the mark price, and hence traders with short positions pay traders who have opened long positions.
Author

John Isige
FXStreet
John Isige is a seasoned cryptocurrency journalist and markets analyst committed to delivering high-quality, actionable insights tailored to traders, investors, and crypto enthusiasts. He enjoys deep dives into emerging Web3 tren


