Polygon whales buy the dip as Layer 2 competition heats up
- Polygon’s native token MATIC has shed 42% of its market value between July 12 and August 17.
- The recent but sudden drop in price has attracted whales that are likely accumulating.
- If this trend continues, the Layer 2 token is likely primed for a quick and explosive uptrend, provided Bitcoin does not crash.


Polygon (MATIC) price dropped roughly 42% between July 12 and August 17, mainly driven by the Bitcoin price crash in mid-August. This downtick in BTC caused a lot of altcoins to slide lower, but on-chain metrics show that MATIC seems to be favored by whales, making it more likely to experience a comeback soon.
Also read: Matter of opportunity or concern for Cardano, Polygon and Arbitrum investors
Polygon price shows signs of shooting up
Polygon (MATIC) price has set lower lows between June 9 and August 20, but the momentum indicators Relative Strength Index (RSI) and Awesome Oscillator (AO) have produced higher lows in the same period. This disparity is termed bullish divergence and is the first sign that a recovery rally is on its way.
The Wave Trend indicator is yet to produce a bullish crossover on the three-day chart in the oversold level. Hence, a potential continuation of the downtrend is likely in the short term. While Polygon price produces another lower low, RSI and AO are likely to produce another higher low. Such a development will further highlight the bullish divergence and cause the altcoin to coil up.
The subsequent breakout from this rangebound movement is likely to trigger a volatile breakout. In such a case, Polygon (MATIC) price could retest the midpoint of the 42% crash at $0.705, $0.750 or $0.782. In some cases, the Layer 2 token could further retest the $0.814 hurdle, bringing the total gain to 47% from the current level of $0.553.
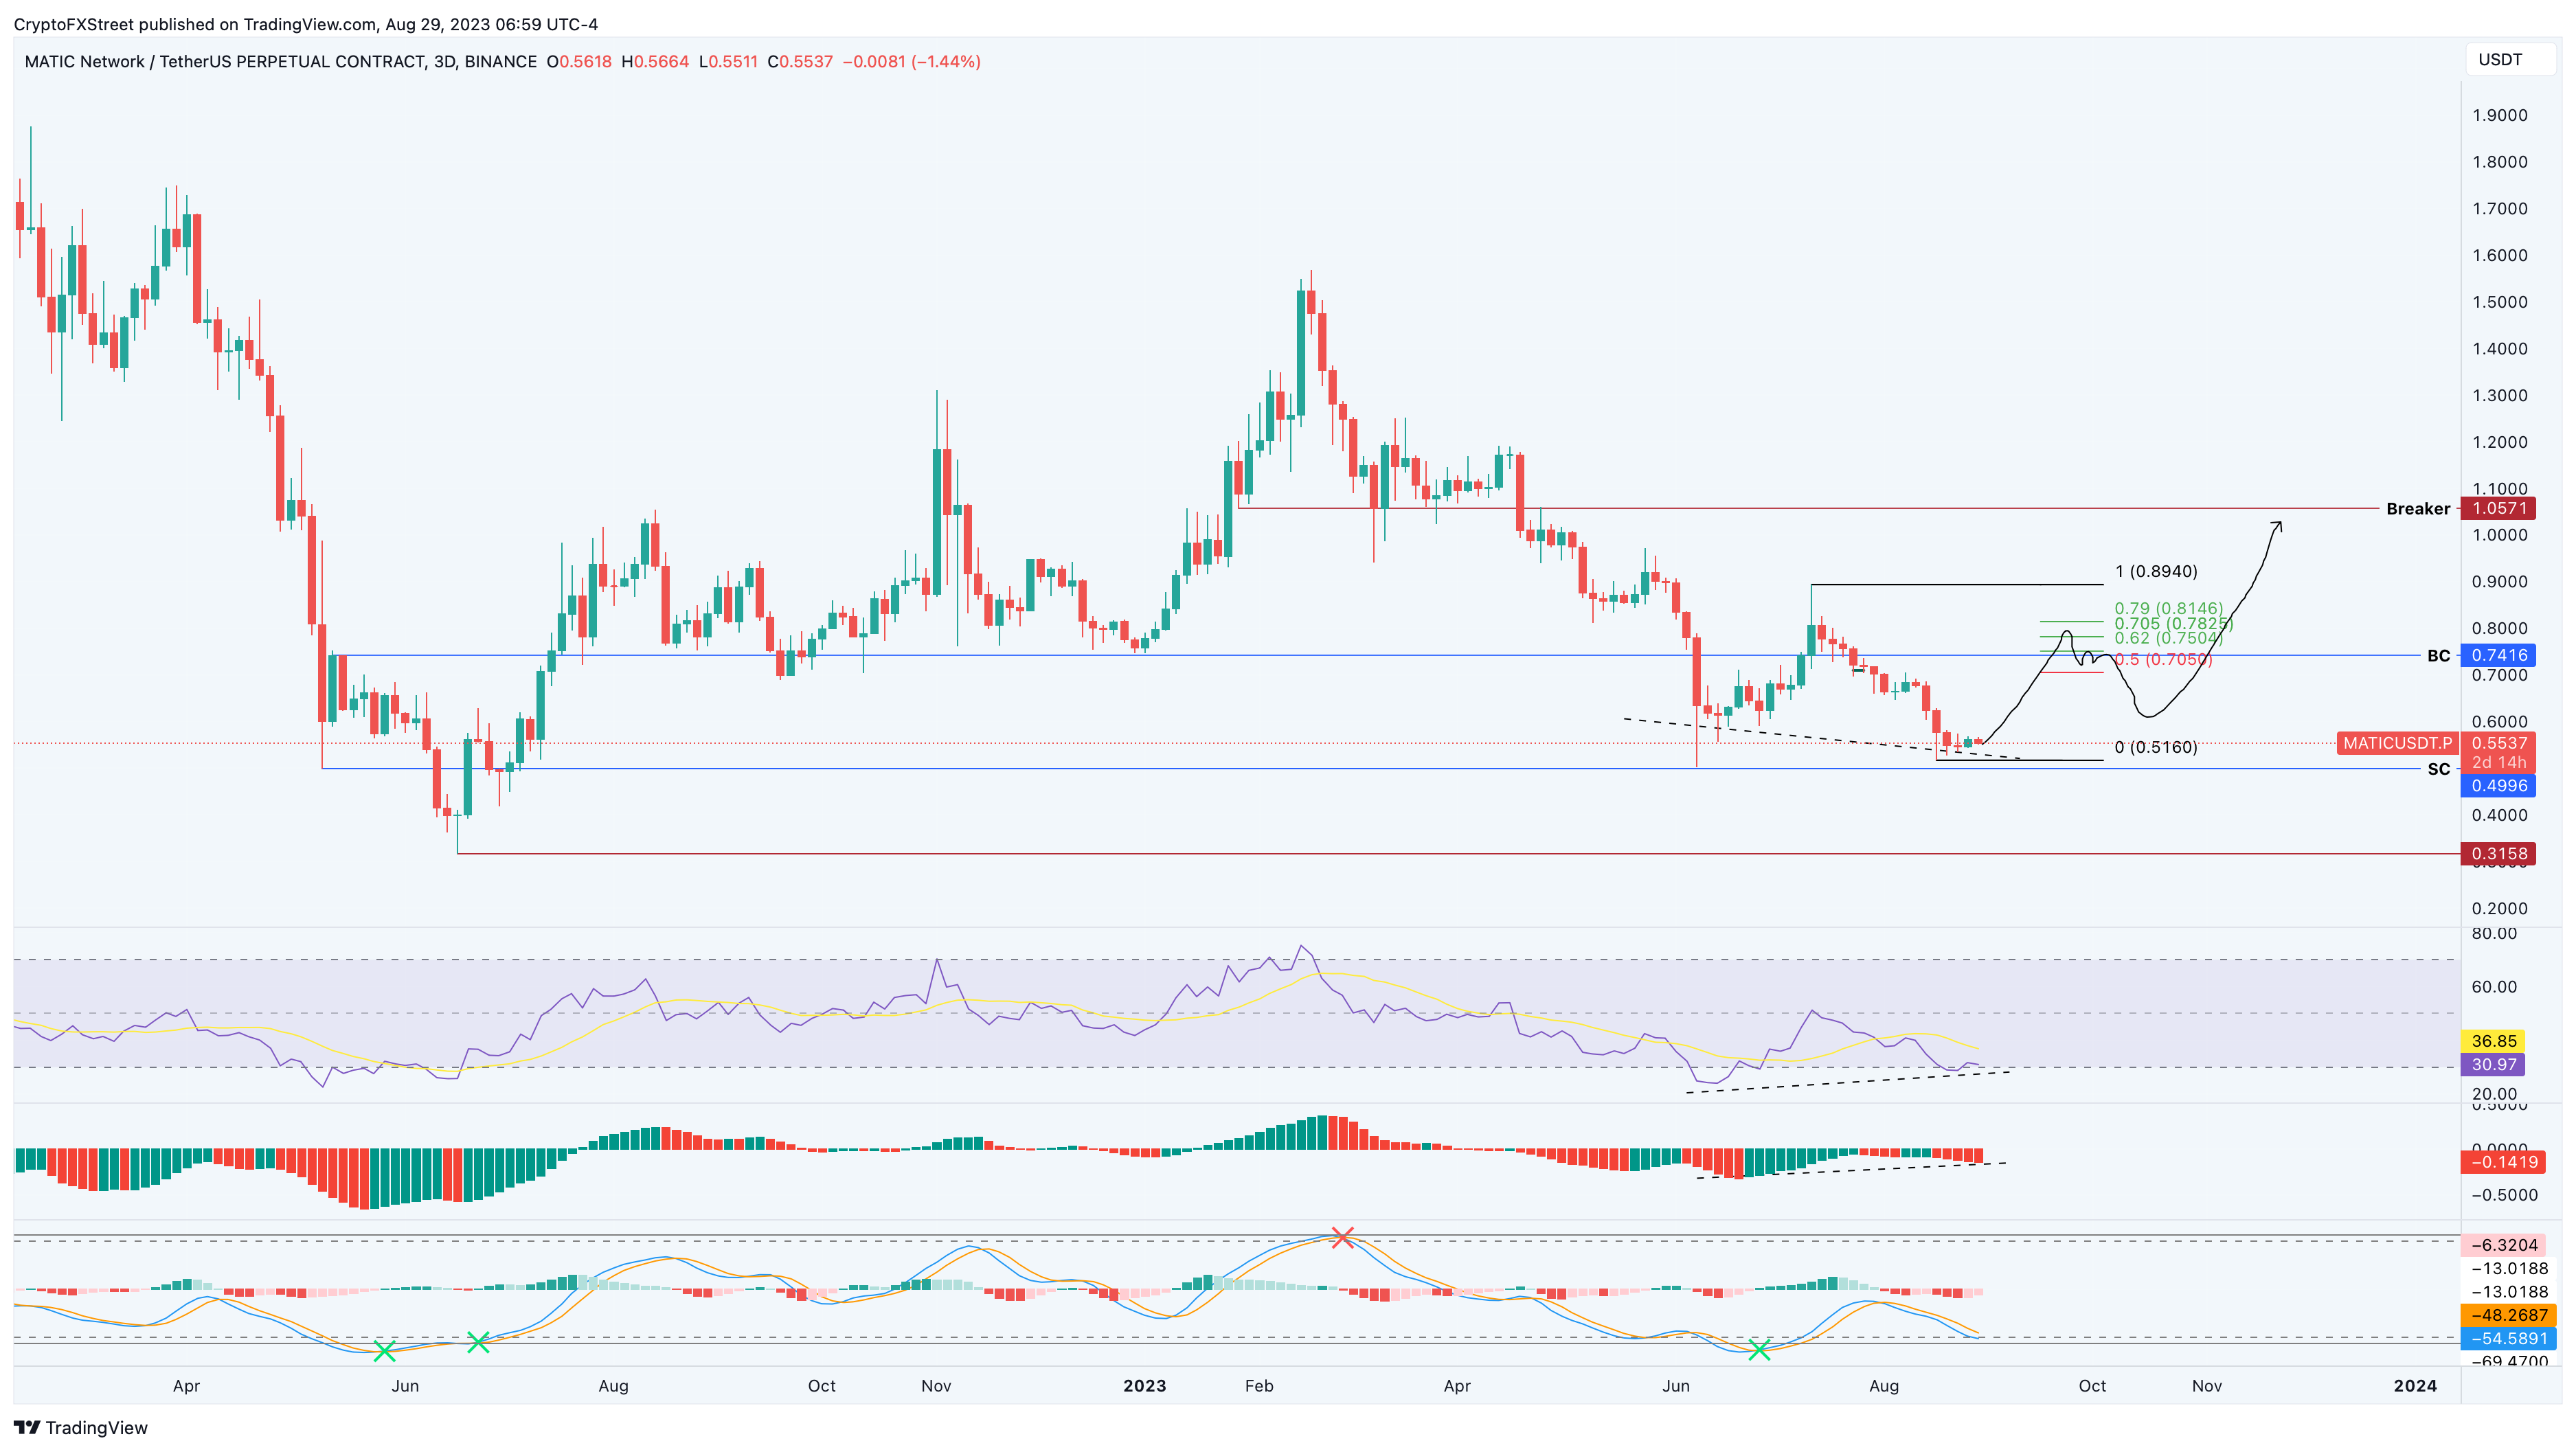
MATIC/USDT 3-day chart
Supporting this bullish outlook for Polygon (MATIC) price would be the whale transaction metric that tracks transfers worth more than $1 million. A spike in this metric after a rally would generally indicate a sell signal, but the same uptick during or after a downtrend is attributed to accumulation from whales. In this case, data from Santiment shows that whales, or large-wallet investors, have recently increased their holdings of the token despite the price decline.
 [11.23.16, 29 Aug, 2023]-638289215853339259.png)
MATIC whale transaction count
On the other hand, a breakdown of the selling climax at $0.499 will invalidate the bullish thesis by producing a lower low. In such a case, MATIC price could crash 42% and revisit the $0.315 support level.
Like this article? Help us with some feedback by answering this survey:
Author
Akash Girimath
FXStreet
Akash Girimath is a Mechanical Engineer interested in the chaos of the financial markets. Trying to make sense of this convoluted yet fascinating space, he switched his engineering job to become a crypto reporter and analyst.