Polkadot technology adoption with NFTs and gaming could see DOT price double
- Polkadot price shows signs of a 132% uptrend after a corrective phase.
- DOT technology is being implemented with Effinity to bring NFT and gaming under a single roof.
- A breakdown of the August 26 swing high at $23.45 will invalidate the bullish thesis.

Polkadot price is experiencing a sudden downswing as major sell signals emerge on multiple time frames. While the short-term outlook seems bearish, things are looking up for DOT in the future.
Efinity to take gaming and NFTs to a new level
Non-fungible tokens (NFTs) have been quite the buzzword after the run-up in 2021. The hype even pushed major traditional market players like Sotheby’s to jump on the NFT bandwagon, selling the Bored Apes collection for a whopping $24.4 million on September 9.
#AuctionUpdate 101 Bored Ape Yacht Club NFTs just sold for $24.4 million and 101 Bored Ape Kennel Club NFTs achieved $1.8 million in our Ape in! auction - the most significant #BAYC sale to date. Congrats to all the apes out there pic.twitter.com/e7UghlgtKy
— Sotheby's (@Sothebys) September 9, 2021
Moreover, the world’s largest museum State Hermitage raised $440,000 via NFT auction on September 7 on the Binance NFT platform. The frenzy around NFTs is undeniable, this is just the beginning, considering how NFTs are crossing over to the gaming ecosystem.
The most relevant example of this is the Axie Infinity game, which uses in-game NFTs and has a marketplace around it. Still, the Efinity blockchain is trying to take this to the next level.
Effinity is a purpose-built blockchain developed by Polkadot with substrate development support from Parity Technologies. In effect, it is a cross-chain token connection to enable the widespread adoption of NFTs.
End-users will not even need to create a MetaMask wallet or hold ETH in it to access their NFTs. In fact, users can transfer their NFT holdings from one blockchain to another. Efinity selected Polkadot among other networks like Near, Flow and Cosmos due to its customizable feature. During a recent interview with Crypto.Com, Enjin CTO Witek Radomski stated,
Polkadot is actually ideal for what we are trying to build. We are trying to put NFTs as the native/main token on the network. With Efinity, we can just remove friction points… people can start playing a game and basically receive, send and craft NFTs, and they won’t even know they are using Polkadot.
Furthermore, Radomski said they want to be a platform that allows people to use NFTs interactively no matter what chain they are on, where users do not have to leave the game experience to access their NFT collections.
Considering the massive size of the gaming industry, a mainstream penetration of the NFT into this ecosystem will be huge. Since Polkadot will be powering these use-cases, this development will be a massive boost to its fundamental value, reflecting its market value over the coming days.
Polkadot price eyes a massive upswing
Polkadot price has created two swing lows and a cluster of swing highs since late December 2020. Connecting these swing points using trend lines shows the beginnings of a multi-month ascending parallel channel.
Although DOT recently sliced through the channel’s middle line, it has yet to create a second swing high around $50.
Investors should pay attention to the Momentum Reversal Indicator (MRI), which has flashed a sell signal in the form of a red ‘two’ on the 3-day chart. This technical formation forecasts a one-to-four candlestick correction.
Similarly, a warning sign is also being formed on the weekly chart in the form of a yellow down candlestick. This development suggests that a continuation of the uptrend will result in a sell signal on the weekly time frame.
While both the sell signals are bearish, they are from a short-term perspective and are not likely to result in a massive drop on a larger outlook. The correction could push the DOT price down to $31.97 and retest the $27.68 barrier in a worst-case scenario.
Getting this pullback over with will allow the buyers to kick-start a new uptrend. The first immediate resistance level that will hinder the uptick in buying pressure is $35.13, but a breach of this barrier will propel DOT to $43.64 after a 23% ascent.
Following this uptrend, if the buyers manage to produce a decisive daily close above $43.64, Polkadot price will tag the $50 psychological level, coinciding with the upper trend line of the parallel channel.
Here, DOT bulls will face a critical decision. If the buying pressure manages to flip the trend line acting as resistance into support, it will open the path for the second leg of the rally to the 161.8% Fibonacci retracement level at $73.81. This move will set up a new all-time high for DOT and represents a 132% ascent from the $31.97 support floor.
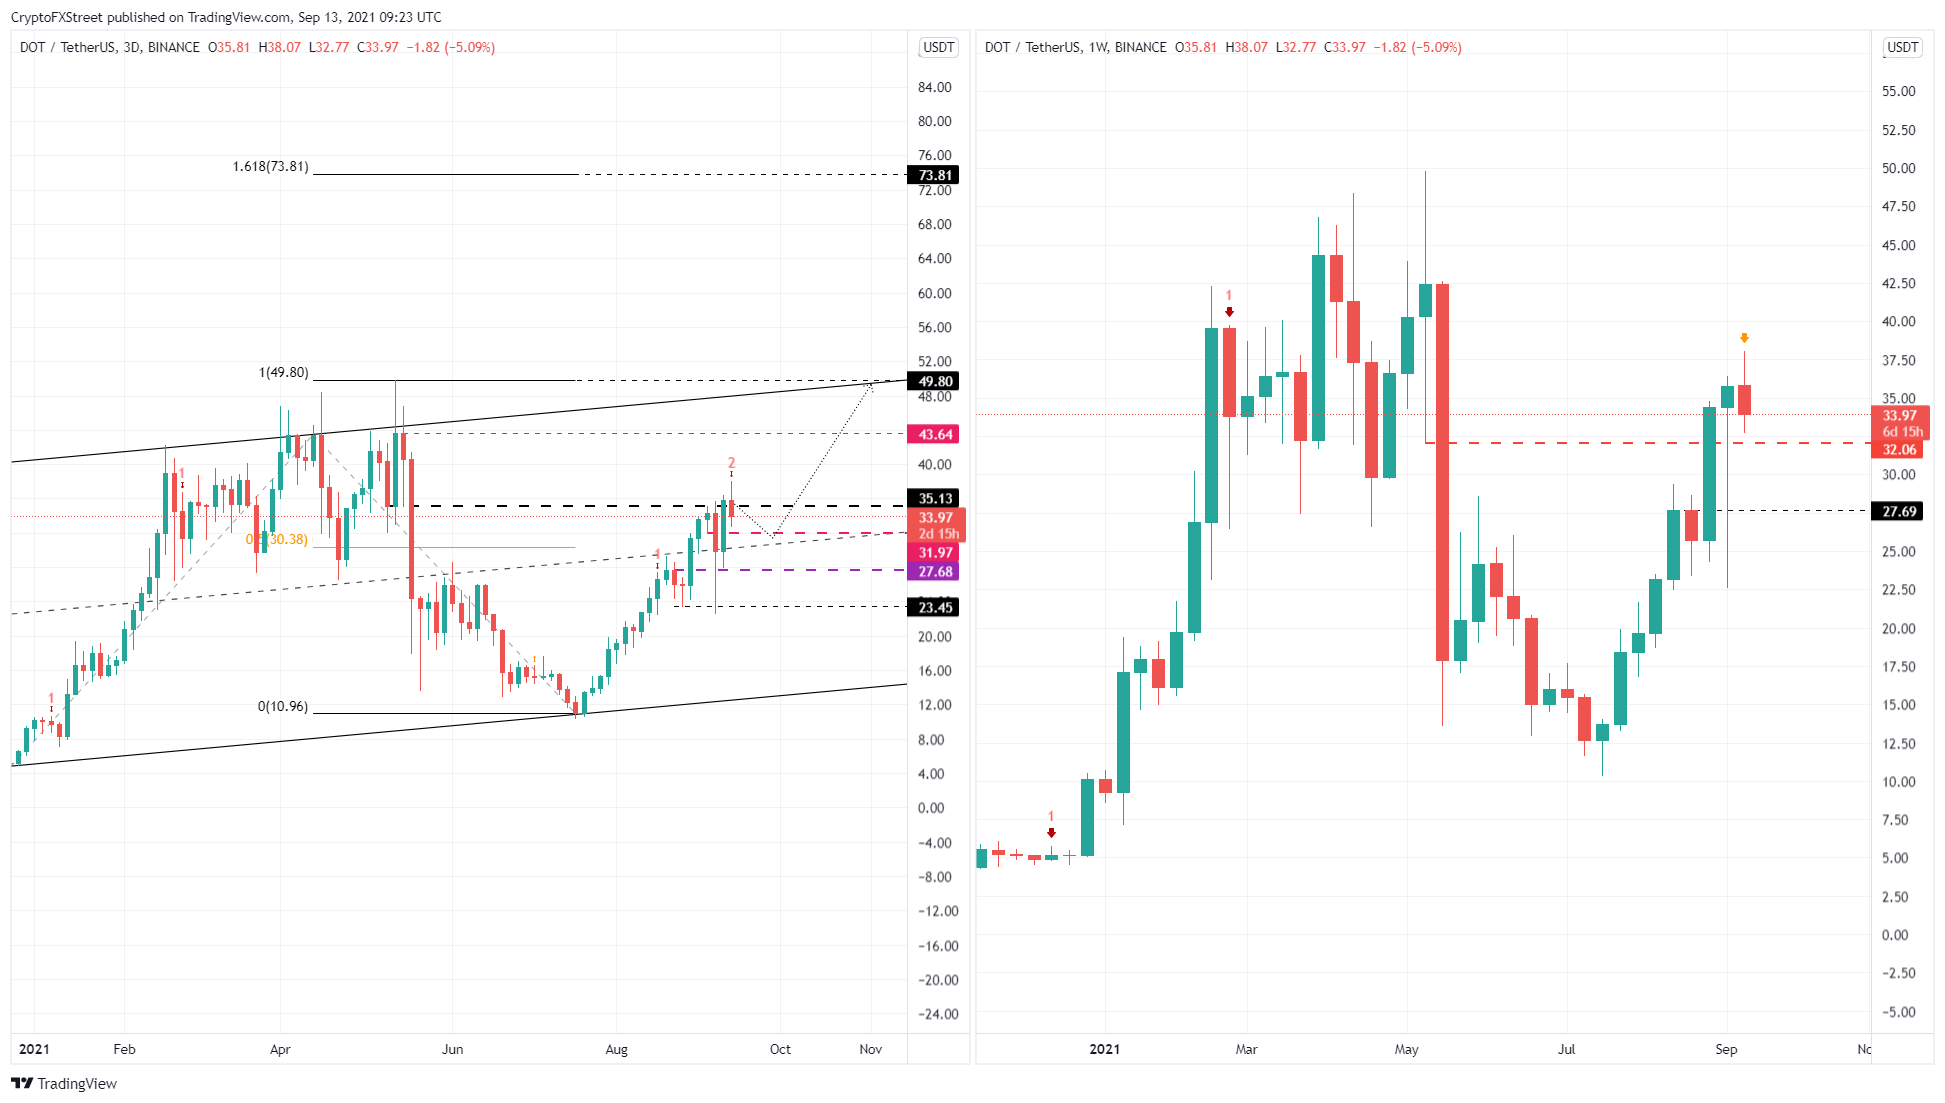
DOT/USDT 3-day, 1-week chart
On the other hand, if Polkadot price fails to stay above the $27.68 support level, it will indicate weakness among buyers and suggest increased selling pressure. However, a convincing daily candlestick close below the August 26 swing low at $23.45 will invalidate the bullish thesis.
In such a case, DOT could continue to head lower and retest the lower trend line of the parallel channel at $10.96, in a highly bearish case.
Author

Akash Girimath
FXStreet
Akash Girimath is a Mechanical Engineer interested in the chaos of the financial markets. Trying to make sense of this convoluted yet fascinating space, he switched his engineering job to become a crypto reporter and analyst.



